9 Working With Reports
Oracle Test Manager contains two tabs for viewing and creating reports. The Reports tab lets you access standard reports and create your own custom reports that you can either keep private or make available to all Oracle Test Manager users. Reports can be saved, emailed, and exported to various formats.
Note:
The standard reports that are available is configured by your administrator so that not all reports may be available to all users.The Dashboard tab displays a high-level view of several reports. The reports that are displayed on this tab can be customized and the view can be saved. These reports can be enlarged into a separate window and then exported to various formats.
9.1 Viewing Reports
To view reports:
-
Click the Reports tab.
-
Expand the node containing the report that you want to view.
-
Select the report. It is displayed in the right pane.
-
In the Report View, click once on the chart to activate it. You can mouse over the chart or graph to view the value of each slice or bar. Tables do not have a report view.
-
Click the Data View tab to view the data in a table.
9.2 Adding Custom Reports
You can add a custom report that can optionally be saved. Custom reports can be designated as either public, that is, available to all users, or private, available only to you.
To add a custom report:
-
Click the Reports tab.
-
Click Add. The Add Report dialog box is displayed.
Define report - this node lets you define the type of report that you want and the fields that you want to display in it.
Report title - enter a title for the report. The title is displayed in the right pane and in the report tree.
Report category - this field is only displayed when you are editing a report. Select whether the report is to be public or private.
-
Public Reports - the report is available to all users under the Public Reports node in the location that you select.
-
My Reports - the report is available only to you. It is listed under My Reports or another node that you create.
-
<location> - select where to save the report. The categories listed are those that are available under the Public Reports or My Reports nodes. Click New to create a new category.
Report on - select the type of data you want to report on: Requirements, Tests, Issues, Test Steps, Test Run, Test Sets, or Test Set Runs. Test Run reports include the runs for test cases executed from the Tests tab. Test Set Run reports include the runs for test cases executed from the Test Execution tab.
Report type - select the type of report you want to display. Click on the question mark icon to display a sample of the selected report type.
-
Vertical bar chart - displays a vertical bar chart of the selected fields.
-
Horizontal bar chart - displays a horizontal bar chart of the selected fields.
-
Pie Chart - displays a pie chart of the selected fields.
-
Cross tab - displays a spreadsheet of the selected fields.
-
Text Report - displays a text report of the selected fields.
-
Trend Report - this report shows the total number of items in a specific status (or other option list field) by week, day, or month, over the specified date range.
-
Special table report - this option is automatically selected when you are reporting on test steps.
The following fields are displayed for vertical bar charts, horizontal bar charts, and pie charts:
-
Available fields - lists the fields that are available for the type of data you are reporting on.
-
<right arrow> - adds the selected fields to the Selected fields list.
-
<left arrow> - removes the selected fields from the Selected fields list.
-
Selected fields - shows the fields that will be included in the report.
The following fields are displayed for cross tab reports:
-
Available fields - lists the fields that are available for the type of data you are reporting on.
-
<right arrow> - adds the selected fields to the Selected fields list.
-
<left arrow> - removes the selected fields from the Selected fields list.
-
Rows - shows the fields that will be displayed in the rows of the report.
-
Columns - shows the fields that will be displayed in the columns of the report.
The following fields are displayed for text reports:
-
Available fields - lists the fields that are available for the type of data you are reporting on.
-
<right arrow> - adds the selected fields to the Selected fields list.
-
<left arrow> - removes the selected fields from the Selected fields list.
-
Selected fields - shows the fields that will be included in the report.
-
Sort By - shows the fields that will be used to sort the report.
The following fields are displayed for trend reports:
-
Start date - select the date on which you want to start reporting by clicking on the calendar icon.
-
End date - select the date on which you want to end reporting by clicking on the calendar icon.
-
Trend by - select how you want to trend the data, day, week, or month.
-
Trend of - select the field that you want to show the trend of. The fields vary depending on the data you are reporting on.
-
Select Trend options - select the option on which you want to trend. The options are based on what you selected in the Trend of field.
The following fields are displayed for test step reports:
-
Available Test fields- lists the fields that are available for tests.
-
<right arrows> - adds the selected fields to the Selected fields or Columns list.
-
<left arrows> - removes the selected fields from the Selected fields or Columns list.
-
Selected Test fields - shows the fields that will be included in the report.
-
Available TestStep fields - lists the fields that are available for test steps.
-
Columns - shows the fields that will be included in the report.
The following options and fields are displayed for test run reports:
-
use last run result - when selected, each test report contains only the last result.
-
use all run results - when selected, each test run report contains all test runs results based upon the specified filters. The filters saved for the Test Run reports are only available within the Reports tab. The saved filters are not available from within the Test tab.
-
Available Test fields- lists the fields that are available for tests.
-
<right arrow> - adds the selected fields to the Selected fields list.
-
<left arrow> - removes the selected fields from the Selected fields list.
-
Selected Test fields - shows the fields that will be included in the report.
The following fields are displayed for test sets reports:
-
Available fields- lists the fields that are available for tests.
-
<right arrow> - adds the selected fields to the Selected fields list.
-
<left arrow> - removes the selected fields from the Selected fields list.
-
Selected fields - shows the fields that will be included in the report.
The following fields are displayed for test set runs reports:
-
Group records by- specifies how to group items in the report: Group by Test Set or Group by Test Case.
-
Available fields- lists the fields that are available for tests.
-
<right arrow> - adds the selected fields to the Selected fields list.
-
<left arrow> - removes the selected fields from the Selected fields list.
-
Selected fields - shows the fields that will be included in the report.
-
Sort By - shows the fields that will be used to sort the report.
-
-
If you want to further filter the data you are including in the report, click Define filters.
Saved filters - lists the saved filter configurations. Select a saved filter to edit or delete it.
Save - displays the Save Criteria dialog box for saving the settings. Filters do not have to be saved.
Delete - deletes the selected saved filter.
Search for - select whether you are searching requirements, tests, or issues. If you are filtering a report, this fields defaults to the type of data you are reporting on and cannot be changed.
that match - select how to apply the filtering criteria.
-
all - match all of the configured criteria. This setting places an AND between the criteria. For example, if you wanted to view all issues with a high priority that are assigned to you, use this option.
-
any - match any of the configured criteria. This setting places and OR between the criteria. For example, if you wanted to view all issues with either a high priority or a high severity, use this option.
-
a combination - this setting lets you combine AND and OR. For example, if you wanted to view all issues assigned to Mary or Caren with a high priority, use this option. This option lets you select how to group the criteria using parenthesis as required. For example:
(((Assigned to = Mary OR Assigned to = Caren) AND Priority = High) OR Severity = High)
<left parenthesis> - select the left parenthesis up to three. This field only appears if a combination is selected as the match type.
Field - select the field that you want to use to select the items to display. For Report filters, the field names include either an asterisk (*) or a hash (#) mark. Fields marked with an asterisk (*) indicate Test Case fields. Fields marked with a hash (#) indicate Test Set fields.
Operator
-
Equals - causes only items that match the value for the selected field to be displayed.
-
Not Equal to - causes only items that do not match the value for the selected field to be displayed.
-
<= - this option is only available when Creation date is the selected field. It causes items less than or equal to the selected date value to be displayed.
-
>= - this option is only available when Creation date is the selected field. It causes items greater than or equal to the selected date value to be displayed.
Value - enter or select the value of the field that you want to use to select the items to display.
<right parenthesis> - select the right parenthesis up to three. This field only appears if a combination is selected as the match type.
<operator> - select the operator to use, AND or OR. This field only appears if a combination is selected as the match type.
<delete> - deletes the corresponding criteria.
<expression> - shows the filtering expression you are creating as you select criteria.
If you select Creation Date, a calendar icon is displayed to the right of the Value field for selecting a date. Click on the calendar icon to display the calendar. The calendar has the following options:
dash (-) - toggles the first column displayed between Sun and Mon.
<< and >> - displays the same month in the previous or next year.
< and > - displays the previous or next month.
-
-
Select how you want to match criteria. Select all to match all criteria. Select any to match one criteria. Select a combination to create a filter using a combination of And and Or.
-
Select or enter the first value by which you want to filter.
-
Select Equals if you want to display items that match the value. Select Not Equal to if you want to display items that do not match the value.
-
Select the value to use.
Note:
You can use SQL characters for searching. For example, if you wanted to find all issues that contained Joe Smith and Mary Jones in the description field, you could enter %Joe Smith%Mary Jones% in the value field. -
Repeat these steps to filter to additional levels, if required.
-
Optionally, click Save to save the filter for reuse. The Save criteria dialog box is displayed.
-
Enter a name for the filter and click OK.
-
Click OK. The report is displayed in the right pane. The report is listed in the Report tree as not saved.
-
Click Save if you want to keep the report for future use or make it available to other users. The Save Report dialog box is displayed.
Report name- enter a name for the report. This is the name that will appear in the report tree.
Report category - select whether the report is to be public or private.
-
Public Reports - the report is available to all users under the Public Reports node in the location that you select.
-
My Reports - the report is available only to you. It is listed under My Reports or another node that you create.
<location> - select where to save the report. The categories listed are those that are available under the Public Reports or My Reports nodes. Click New to create a new category.
Report Details - lists the type of report and the data that is being reported on.
-
-
Enter a name for the report. This is the name that will appear in the report tree.
-
Select the category in which to save the report. Select New to create a new category.
-
Click OK.
9.2.1 Working with Test Set Execution Reports
The Other Reports folder under Public Reports folder includes Test Set Execution Summary and Test Set Execution Trend reports that can be used to generate reports for Test Sets executed from the Test Execution tab.
Initially, the Test Set Execution Summary report will contain no data if no Test Sets have been created or executed from the Test Execution tab. However, the Test Set Execution Trend report will contain data for all test runs for all test cases, which in most cases will yield unsatisfactory results. Define a custom report filter to generate a Test Set Execution Trend report specific to your requirements.
To define a custom report filter for a Test Set Execution Trend report:
-
Go to the Reports tab.
-
Expand the Public Reports folder, then expand the Other Reports folder.
-
Select the Test Set Execution Trend report.
-
Click the Filter button on the toolbar.
-
If necessary, select Define filters in the left pane.
-
Select the Fields list and select the field to use to filter the report. For Report filters, the field names include either an asterisk (*) or a hash (#) mark. Fields marked with an asterisk (*) indicate Test Case fields. Fields marked with a hash (#) indicate Test Set fields.
-
Select the Operator and Value to use for the filter. For example, to define a filter to display trend results for a specific Test Set by ID, set the
TestSetId#field equal to the Test Set ID. To define a filter to display trend results for a specific Test Set by name, set theName#field equal to the Test Set name. To define a filer to display trend results for the Last Run Status, set theLast Run Status#field equal/not equal to the desired status. -
Optionally, add additional Field, Operator, and Value sets to refine the filter definition. For example, to generate a report for the last run of a specific Test Set ID, specify the operators and values for the
TestSetId#andLast Run Status#fields, as follows:Figure 9-1 Example Test Set Trend Report Filter
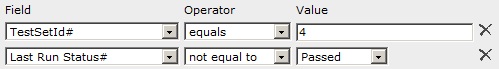
Description of "Figure 9-1 Example Test Set Trend Report Filter"
-
Click OK when finished.
9.3 Editing Custom Reports
Only custom reports that have been saved can be edited. To edit a report:
-
Click the Reports tab.
-
Select the custom report that you want to edit and click Edit.
-
Make any changes to the report definition, report location, or the report filters.
-
Click Apply.
-
Click OK.
9.4 Cloning Reports
Cloning a report is useful when there is an existing report that is close to what you are looking for. You can clone it, that is, make a copy of it, and then edit it to your specifications. To clone a report:
-
Click the Reports tab.
-
Select the report that you want to clone and click Clone. The report is copied and saved at the end of its original category with the words Copy of in front of the report name.
-
Click Edit to display the Edit Report dialog box.
-
Make any changes to the report definition, report location, or the report filters.
-
Click Apply.
-
Click OK.
9.5 Deleting Reports
Only custom reports that have been saved can be deleted. Custom reports that have not been saved will not be available the next time you log in. To delete a report.
-
Click the Reports tab.
-
Click the custom report that you want to delete and click Delete.
-
Click Yes when asked to confirm.
9.6 Emailing Reports
You can email a report to one or more people. For email to work, the SMTP server must be configured using the Oracle Test Manager Administrator. Refer to Section 11.4, "Configuring Email Preferences"for more information.
To email a report:
-
Click the Reports tab.
-
Select the report that you want to email and click Email.
Selected Report - displays the name of the report you are emailing.
Send to - enter the email addresses of the people to whom you want to email this report. Separate email addresses by a comma.
To - displays the Select Email recipients dialog box for selecting recipients from a list.
Subject - enter the text that you want to appear in the subject of the email. The default is the name of the report.
Attach as - select the format in which you want to attach the report, pdf or jpeg.
Message - enter the text that you want to appear in the message.
-
Enter the recipient email addresses separated by a comma or click To to display the Select Email Recipients dialog box.
<recipient list> - lists users in you database that have email notification enabled.
Select - adds the selected recipients to the To field.
To - displays the selected recipients separated by a comma.
-
Select the recipients that you want to receive the report and click Select. Note that only users in your database that have email notification enabled are listed in the dialog box.
-
Click Done when you are finished.
-
Change the subject if necessary.
-
Select the file type in which you want the report to be sent.
-
Enter a message if necessary.
-
Click OK.
9.7 Viewing Dashboard Reports
There are three default dashboard reports, one for requirements, one for issues, and one for tests. You can rearrange the order of the reports, add or remove reports to the display, and save your changes. You can also create new dashboard reports as described later in this chapter. To view a dashboard report:
-
Click the Dashboard tab.
-
Select the dashboard report that you want to view.
-
Select the number of columns to display.
-
Move the reports in the display using the arrows in the toolbar.
-
Click Toggle to display the report tree for adding a report to the display. Double click the report that you want to add to the display.
-
Click the Toggle button to close the report tree.
-
Click Save to display the Save Dashboard to save your changes.
Dashboard name- enter a name for the dashboard report.
Dashboard type - select the type of dashboard report. Public dashboards are listed first in the dashboard dropdown, followed by the private dashboards.
-
Public dashboards - select this option to make this dashboard report available to all users.
-
My dashboards - select this option to make this dashboard available only to you.
-
-
Enter a new name for the Dashboard report, if necessary.
-
Select the type of dashboard report.
-
Click OK.
9.8 Adding Dashboard Reports
To add a dashboard report:
-
Click Add on the Dashboard tab.
-
The report tree is displayed with a blank report on the right. Expand the report tree and double-click on the reports that you want to add. They will be displayed in the right pane as shown in the following example.
-
Click Toggle to close the report tree.
-
Click Save to save the new dashboard report.
-
Enter a name for the dashboard report.
-
Enter a title for the dashboard report.
-
Select whether you want to make this report available to all users or just to yourself.
-
Click OK.
9.9 Deleting Dashboard Reports
To delete a dashboard report:
-
Select the dashboard report that you want to delete from the dashboard dropdown list.
-
Click Delete.
-
Click Yes when asked to confirm.
9.10 Exporting Reports
Reports can be exported from the Reports tab and the Dashboard tab. You can export to jpg from the Report View tab. You can export to xls from the Data View tab. To access the Report View and Data View tabs from the Dashboard report, maximize the report that you want to export by double-clicking the up/right arrow in the toolbar for the specific report. The individual Dashboard report opens in a separate browser window.
9.10.1 Exporting to JPG
To export to jpg:
-
Click the Report View tab of the report that you want to export.
-
Click Export report to jpg then specify the location and file name of the file to save.
9.10.2 Exporting to XLS
To export to xls:
-
Click the Data View tab of the report that you want to export.
-
Click Export to xls. A dialog box opens with the options to open the file in Excel or save the file to disk. Click Open to open the file in Excel (you must have Microsoft Excel installed) or click Save to specify the location and file name of the file to save.