| Oracle® Retail Integration Bus Operations Guide Release 13.0 |
|
 Previous |
 Next |
The RIB provides four types of adapters that Oracle Retail applications can exploit to integrate with one another. These adapter types are publisher, subscriber, TAFR, and hospital retry adapters. They have been built using different technologies based on their particular needs.
Subscriber and TAFR adapters use Message Driven Bean (MDB) technology to register with JMS topics and receive messages for further processing.
Publisher and hospital retry adapters make use of the Java SE (Standard Edition) timer facility to schedule repetitive events. These events trigger calls to Enterprise Java Beans (EJB) to query application tables for messages to publish to the JMS server.
A fifth type of adapter exists for publishing messages in a pushing fashion, which the Retail javaEE applications, such as SIM and RPM, invoke at will for publishing messages. These are not controlled via this framework, they are always on.
Due to the variety of technologies used by the adapters, the goal of RIB Admin UI is to isolate users from these differences and provide a common management interface that can be used to control the state of the adapters and logging.
The RIB Admin tools are reached via URL's within each of the deployed rib-<apps>'s.
http://<server>.us.oracle.com:<http-port>/rib-<app>-admin-gui/
Replace <server> with the name or IP address of the server in the environment that has the rib-<app> deployed.
Replace <http-port> with the port number that the Oracle Application Server is listening on. (for example, 7777)
Replace <app> with either:
rms
tafr
rwms
sim
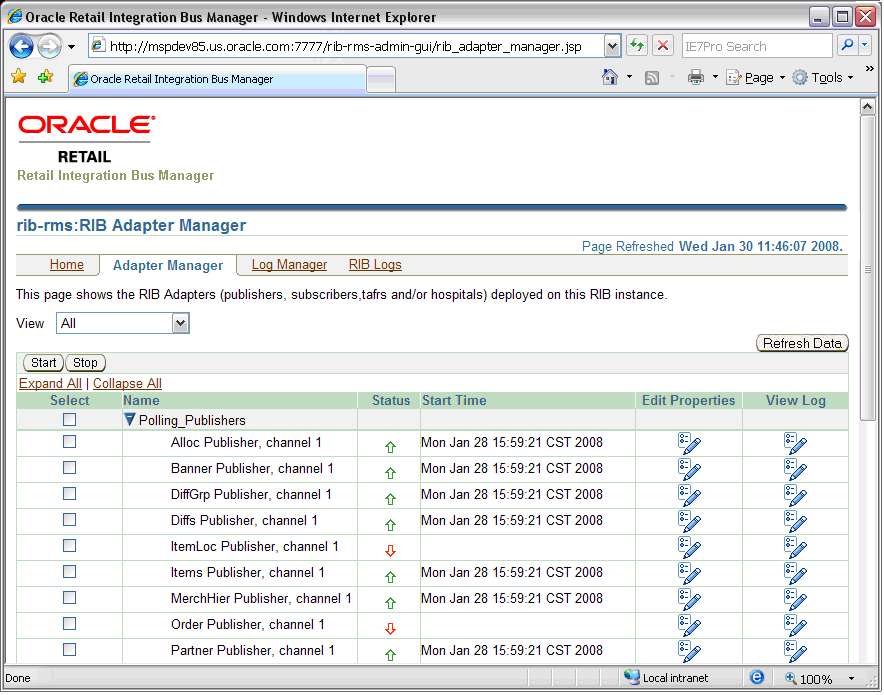
All message functions in the RIB are performed by adapters. There are four categories of adapters: publishers, subscribers, TAFRs (transform, address, filtering and routing), and RIB hospital retry. The adapter manager console is used to start and stop adapters, configure settings, and view adaptor log files.
This screen shows you the current status of all adapters for the specified application. A 
signifies that an adapter is up and running where as 
means that the adapter is offline or has shut itself down. From this screen you can start and stop any listed adapters by selecting the check-box related to the adapter and then using the 
buttons. Clicking the 
button in the "View Log" column takes you to the log file viewer for the specified adapter.

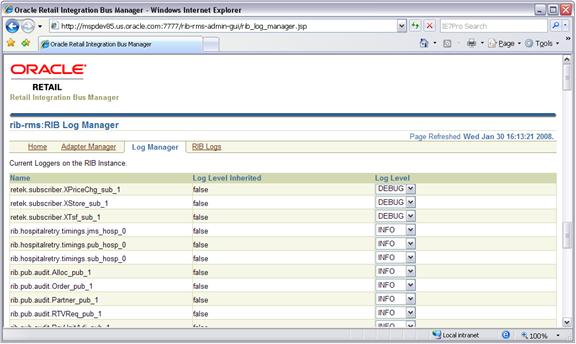
This screen enables the user to change the logging level of the adapters. It also allows the user to enable audit and timings logging.
The UI displays each logger and the current log level. If the log level is inherited, it displays a * along with the log level. The user is able to select a logger and modify the log level by clicking "Set Option". The changed settings are an in memory representation of the logger. If the user wants to persist the log level between an application server bounce, they have the option to click the "Save" button. The save operation updates the log4j.xml file in the file system in the location where it was loaded from.
When Audit logging is turned on, each message that is processed by the adapter, the XML payload is persisted to an audit log. Audit logging only works when the audit log level is set to DEBUG for the specified adapter.
The Timings logging captures adapter processing performance data to another separate log. As with the audit log, this only works with the logging level set to DEBUG. The RDMT command line tool can be used to process and view the results of the timings logging output.

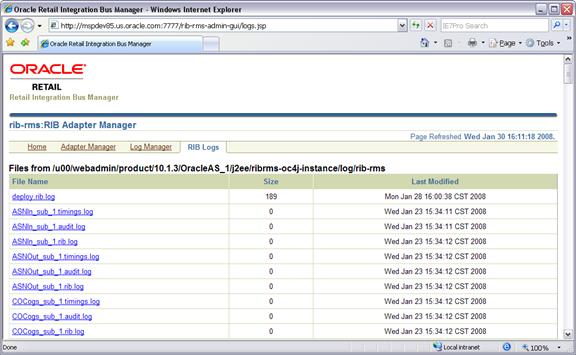
This screen can be used to view the regular adapter log file (also accessible by clicking the 
button in the "View Log" column on the Adaptor Manager screen) along with the Timings and Audit logs for each adapter, if they have been activated (see instructions in the "Log Manager Screen").
