| Oracle® Retail Integration Console User Guide 16.0.023 E90676-01 |
|

 Previous |
 Next |
Performance and diagnostics page shows performance graphs, configuration files, problematic interfaces and logs in addition to the ability to ping services.
The left hand menu allows choosing between RIB and RSB. Depending on the selection RSB or RIB related pages are displayed. By default we show the RIB Performance page.
The drop-down lists all the applications in scope. The data displayed on this tab is at an application level. A graphical and tabular view of the data is provided for the following metrics:
Top (20) RIB Adapters with Highest Event Count: Performance details graph for this metric displays a pie graph showing the event counts for top 20 RIB adapters for the selected application, performance details flows table displays family and total event count for all the adapters of the selected application.
Show (20) Slowest Performing Integration APIs: Performance details graph for this metric displays a pie graph showing the execution time for the 20 slowest RIB integration APIs for the selected application, performance details flows table displays family and execution time (in milliseconds) for all the APIs of the selected application.
Show (20) Slowest Performing RIB Adapters: Performance details graph for this metric displays a pie graph showing the execution time for the 20 slowest RIB adapters for the selected application, performance details flows table displays family and execution time (in milliseconds) for all the adapters of the selected application.
Compare Slow Performing RIB Adapter vs Integration API: Performance details graph for this metric displays a clustered bar graph showing the comparison of execution time for the 20 slowest RIB adapters and the integration APIs for the selected application, performance details flows table displays adapter execution time (in milliseconds), API execution time (in milliseconds) and difference in adapter and API execution time (in milliseconds) for all the adapters of the selected application.
This tab displays the rib-home, where the RIB kernel is located.
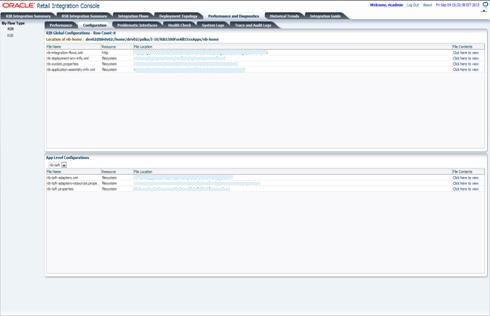
RIB Global Configuration: This table displays the global level files related to RIB.
Application Level Configurations: This table displays the application specific files for applications that are in scope. There is a drop-down that has list of applications in scope. Depending on the app selected, it displays the files specific to that app. The columns in the tables are filename, resource, location of the file and a hyperlink which, when clicked, opens a pop-up window with the file contents.
This tab displays the RIB error hospital data at Global and Application level metrics.
Global Metrics: Transaction details graph and table is displayed for the following global metrics on selecting the respective radio button.
Show Error Hospital Count for all Apps-in-scope: Transaction details graph for this metric displays a pie graph showing the error counts for all the applications in scope, transaction details table displays total messages and dependent messages in error hospital for all the applications in scope.
Show (10) Message Families with Failure Messages vs Dependency Messages: Transaction details graph for this metric displays a bar graph showing failure vs dependency messages error counts for the message families which have highest total messages in error hospital. Each bar in the graph shows the aggregation of the messages in error hospitals for all the adapters for a message family. Transaction details table displays total messages and dependent messages in error hospital for all the adapters of the applications in scope.
App Specific Metrics: There is a drop-down that has list of applications in scope. Transaction details graph and table is displayed for the following app specific metrics on selecting the respective radio button.
Show Top Adapters with Most Errors for <rib-app>: Transaction details graph for this metric displays a bar graph showing failure vs dependency messages error counts for the top 10 adapters with maximum messages in error hospital of the selected application. Transaction details table displays total messages and dependent messages in error hospital for all the adapters of the selected application.
Adapter Status for <rib-app>: Transaction details graph for this metric displays a pie graph showing the running and stopped adapters of the selected application. Transaction details table displays the status for all the adapters of the selected application.
Show JMS Topics with Most Messages Stuck for <rib-app>: Transaction details graph for this metric displays a pie graph showing the messages waiting on the JMS topics for the selected application. Transaction details table displays the subscriber and messages waiting for the JMS topics of the selected application.
This tab displays RIB deployment, JMS connection, and RIB tools data in tabular format.
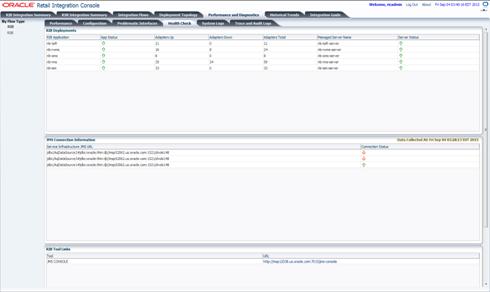
RIB Deployment: This table shows status, number of running, down and total adapters, managed server names and their status for all applications in scope.
JMS Connection Information: This table shows service infrastructure JMS URL and connection status for all the JMS which are configured for JMS console. The Data Collected At label displays the time when data was most recently collected from JMS console monitoring services.
RIB Tool Links: This table displays the URL to JMS console.
This tab displays links to the RIB Admin GUI logs for all applications in scope, for ease of navigation between RIC and RIB Admin GUI.
This tab is only for RSB. It contains the performance details for decorator services. Depending on the choice selected, corresponding performance details graph and performance details table are shown.
If all flows have count equal to zero, the table displays all flows. If one flow has message count greater than zero, the table displays only the top 20 flows per choice selected.
This tab displays the rsb-home, where the RSB kernel is located.
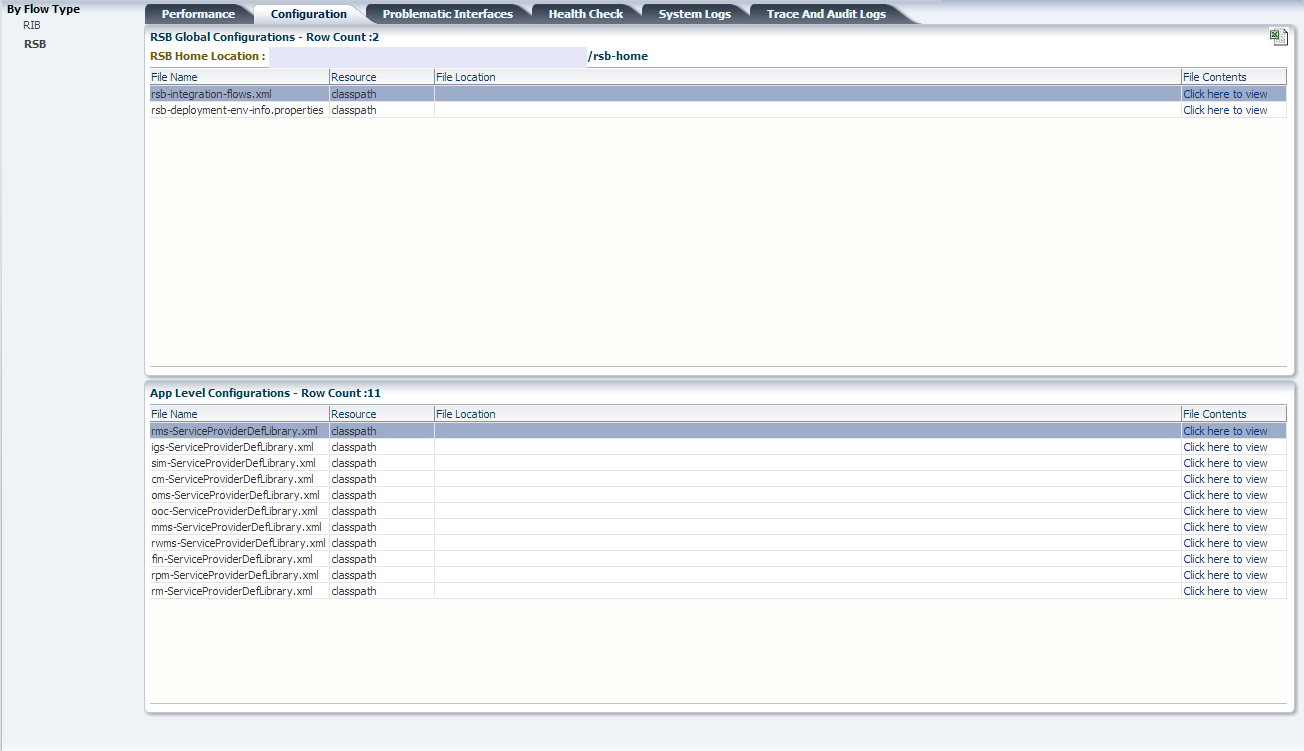
RSB Global Configuration: This table displays the global configuration files related to RSB.
Application Level Configurations: This table displays the application specific files for applications that are in scope.
This tab is only for RSB. This page shows the flows with most errors or system alerts.
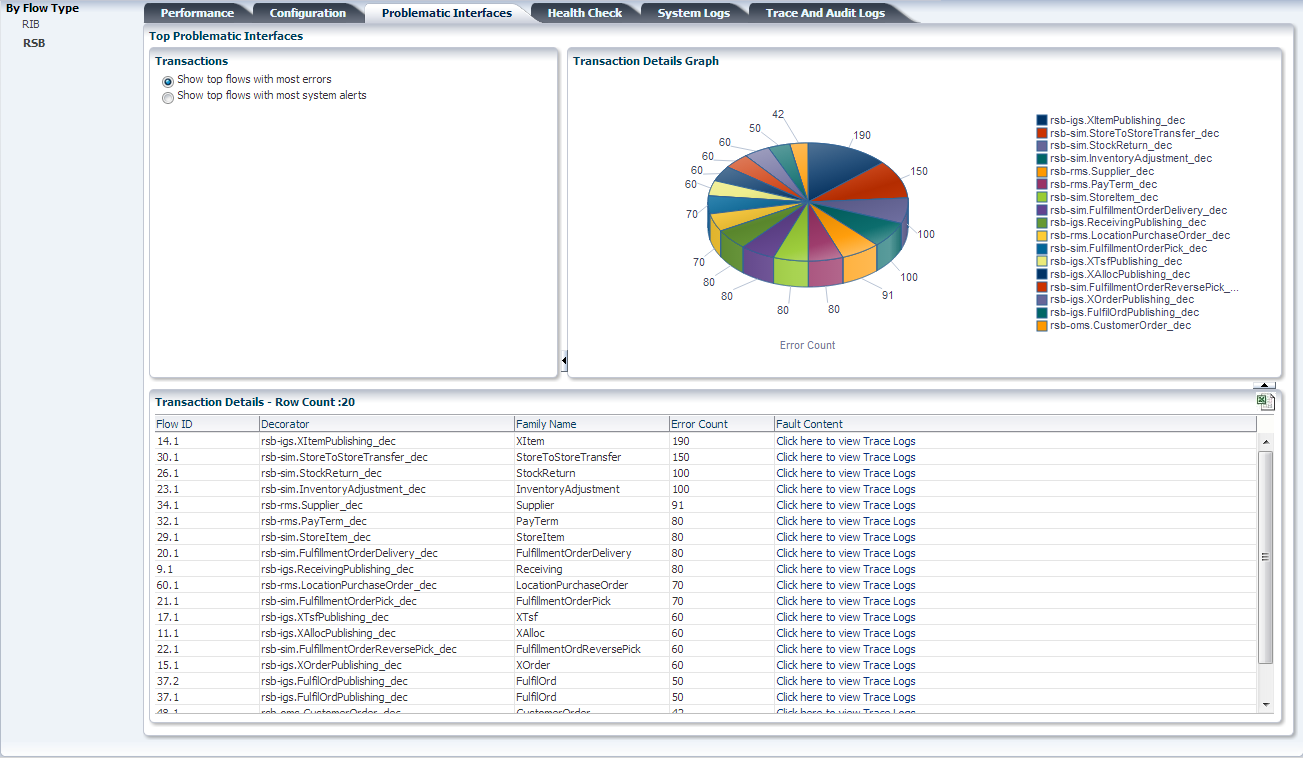
Transactions: Users can choose between two options: top flows with most errors or top flows with most system alerts.
Transaction Details Graph: It shows the errors or system alerts for decorator services in form of pie chart. The services are listed next to the graph.
Transaction Details Table: It shows the columns for flow ID, decorator name, message family name, error count and a link to trace logs. The link takes the user to the Trace and Audit Logs page for the selected decorator.
This tab allows pinging services as well as database connectivity. When a ping operation is called, the service invocation goes through edge app service through decorator and back. The user can also test database connectivity in this page.
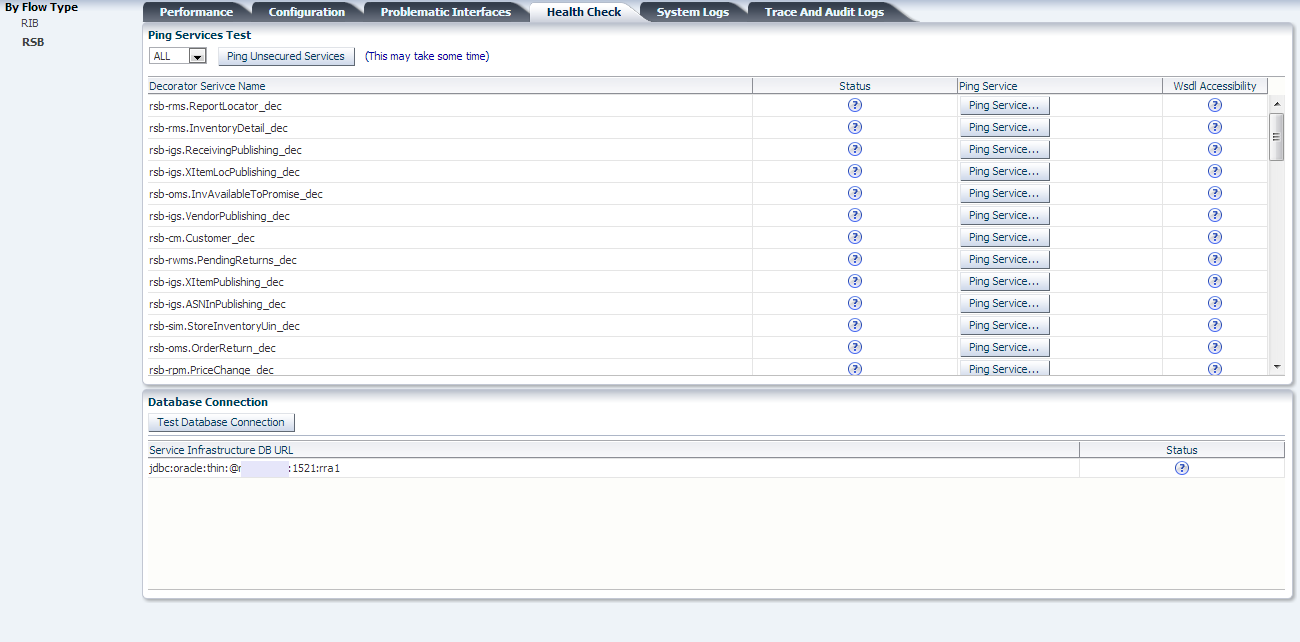
The page has a drop-down list that contains all the applications that are in scope. The default value is ”ALL”. By default, the table shows all the decorator services in scope. When we choose an application from the drop-down list, all the services related to that application are displayed.
Ping Unsecured Services: Invokes ping operation for all the services that are not secured.
The table in the page contains the decorator name, Status, Ping Service button and WSDL Accessibility. Initially the statuses of the service and WSDL are shown as unknown. When the Ping Service button is clicked, a popup screen is displayed. The popup has service details including WSDL URL, decorator name, web service policy name and the input message. If the service is secured, it has additional input fields: edge app service user name and password that are needed to ping that service. The statuses are shown as UP or DOWN depending on whether the services are available or not.
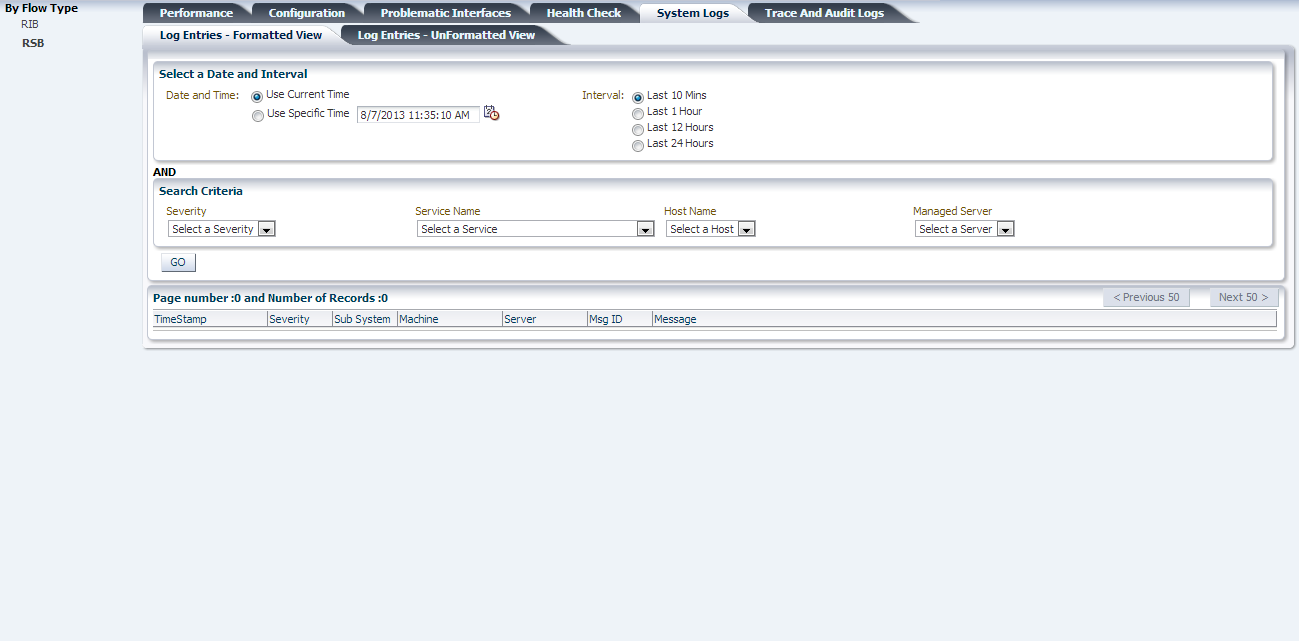
This tab displays the system logs retrieved from under <weblogic-home>/<domain-name>/servers/AdminServer/logs/<domain-name>.log.
There are two search panels that can be used as search criteria. Fields in the first search panel are mandatory, current time is the default value for the Date and Time field and Last 10 mins is the default value for the Interval field. The second search panel has Severity, Service Name, Host Name, and Managed Server drop-down lists. These are optional fields to filter the result.
When you click GO, the table displays the data matching the search criteria.
There are two search panels that can be used as search criteria. Fields in the first search panel are mandatory, Current Time is the default value for Date and Time and Last 10 Mins is the default value for Interval. The second Search panel has Severity, Service Name, Host Name and Managed Server drop-down lists. All these dropdowns are optional fields.
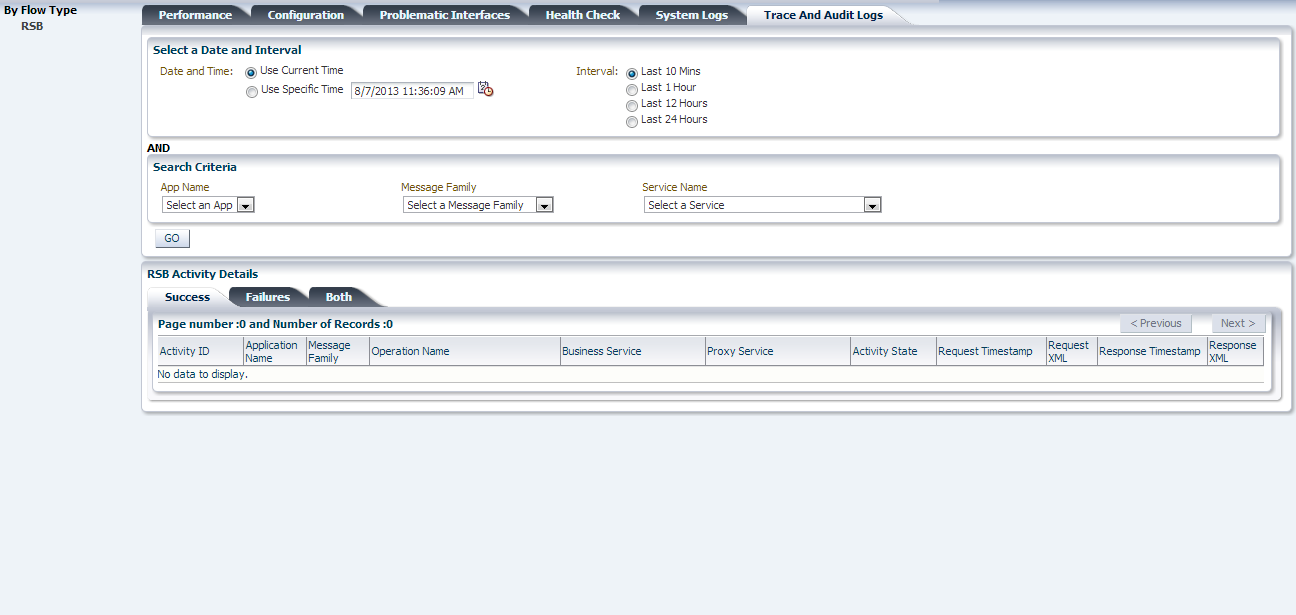
On click of the GO button, the table displays the data matching the search criteria. There are three tabs in the result panel.
Success: This tab shows only the success entries
Failures: This tab displays only failed invocations
Both: This tab displays both the success and failure logs
