| Oracle® Retail Integration Console User Guide Release 16.0.027 E97037-01 |
|

 Previous |
 Next |
The RSB Integration Summary page shows a one page view of the overall RSB integration infrastructure. This page shows transaction counts by application, service execution success and failure counts by application, average service call response time by application, top problematic interfaces and CPU and memory usage of RSB servers. The summary information is for applications that are in scope and servers for the last 24 hours.
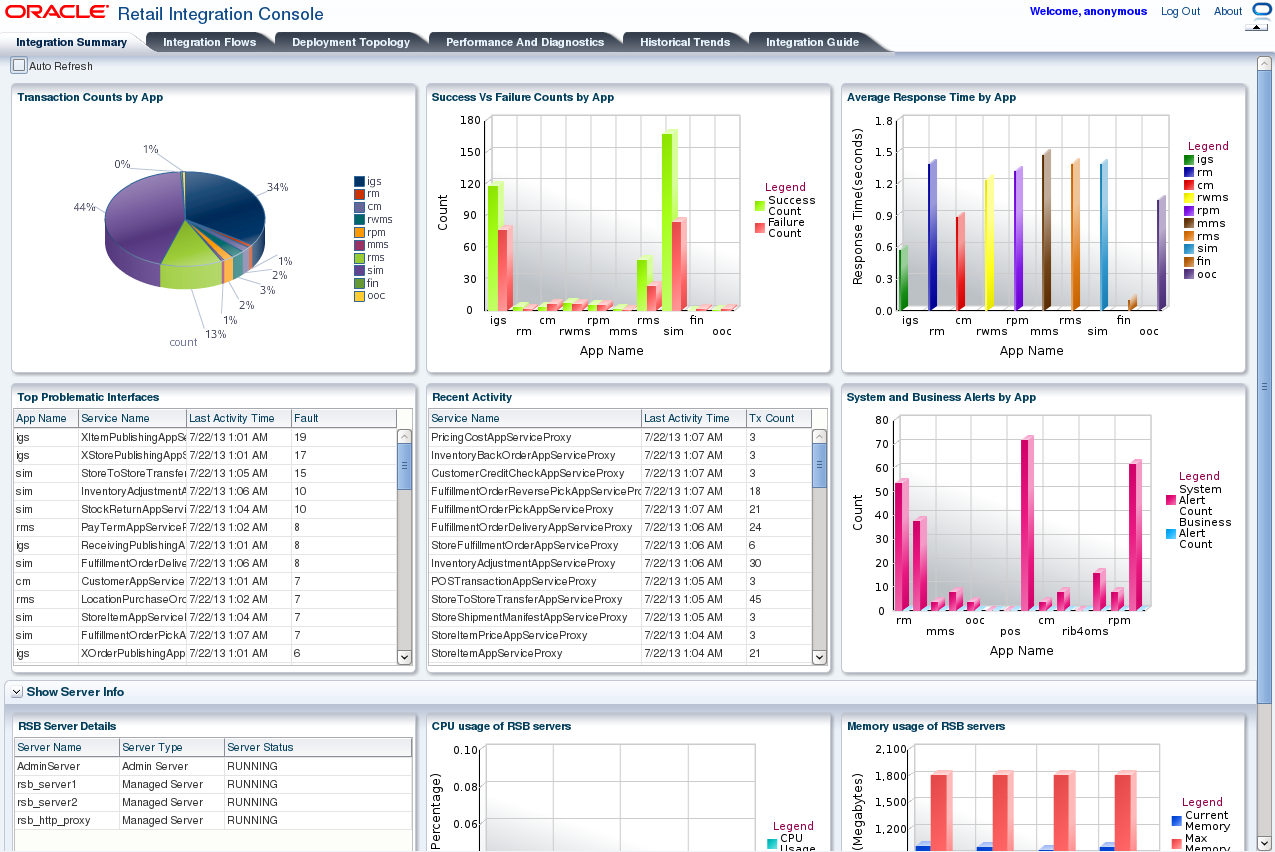
The Auto Refresh checkbox, if checked, would poll for data for the first six graphs for every 10 seconds and polls for data for the last three graphs (Server Info graphs) every 5 minutes.
Transaction Counts by Application: A pie graph that shows the total number of transactions for each application in the last 24 hours from the database.
Success versus Failure Count by Application: This graph shows the number of successful transactions and the number of failed transaction for each application. The number of success count versus failure count for an application is distinguished by activity_state in database table. If the activity_state value is RESPONSE, it is a successful invocation. If it is ERROR, it is counted as a failure.
Average Response Time by Application: This graph displays the average response time taken by each application to process the requests. The time is shown in seconds.
Top Problematic Interfaces: This table displays the number of faults for each proxy service, along with data about the application that the proxy service belongs to and the time of the most recent transaction failure.
All the data is displayed in descending order showing the proxy service with maximum number of faults first.
Recent Activity: This table shows the list of proxy services with latest invocation time and the total number of requests processed by it. This table is sorted by the last activity time (latest first).
System Alerts and Business Alerts by Application: This bar graph displays SLA alert and business alert count for each application. These alerts are retrieved from OSB console using JMX API.
SLA alerts are automated responses to violations of Service Level Agreements (SLAs). These alerts are displayed on the Oracle Service Bus dashboard. They are generated when the service violates the service level agreement or a predefined condition. Business alerts (Pipeline alerts) can be generated in a message flow whenever you define an alert action under the reporting category in the message flow and the alert condition is met.
Show Server Information: This section contains the information about the server usage.
RSB Server Details: This table displays the list of servers in the RSB cluster (Admin server and managed servers) and their statuses.
CPU Usage for RSB Servers: This graph displays the CPU usage for each server in the RSB cluster.
Memory Usage for RSB Servers: This graph displays the memory usage (Current memory, max memory and free memory) for each server in the cluster.
