| Oracle® Product Lifecycle Analytics Multi-Dimensional Schema Data Reference Manual Release 3.6 E84200-01 |
|

 Previous |
 Next |
| Oracle® Product Lifecycle Analytics Multi-Dimensional Schema Data Reference Manual Release 3.6 E84200-01 |
|
Previous |
Next |
This chapter consists of the Entity Relationships in the Oracle Product Lifecycle Analytics MDS.
ER Diagrams for Agile A9 PLM Source
The ER's under the following sections are specific to only Agile A9 PLM source:
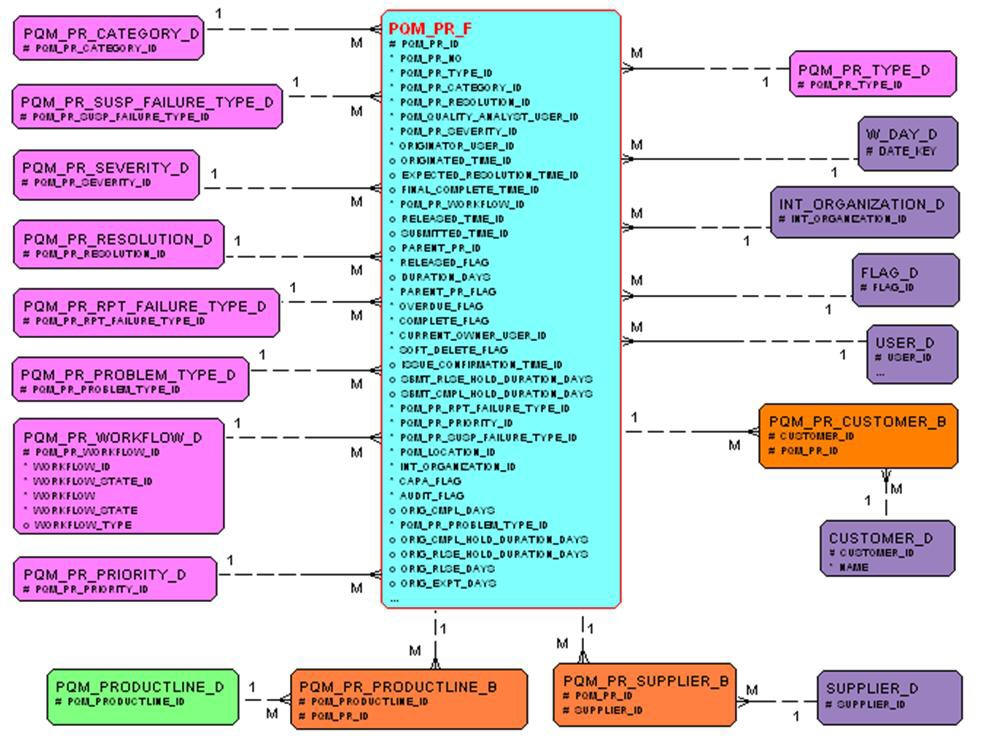
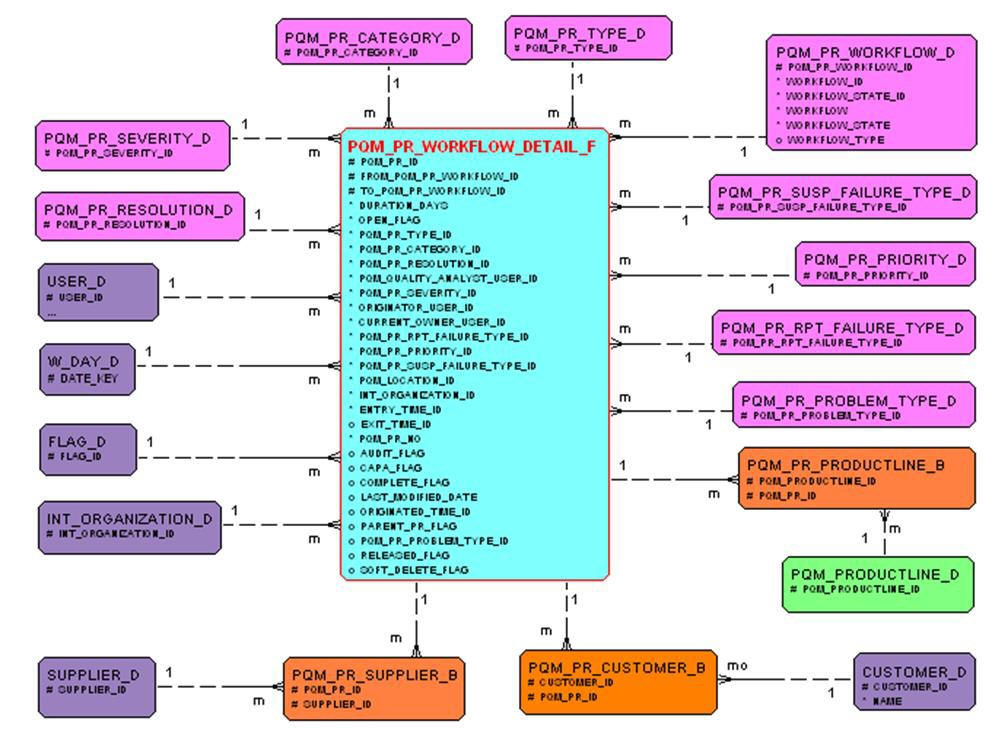
Problem Reports
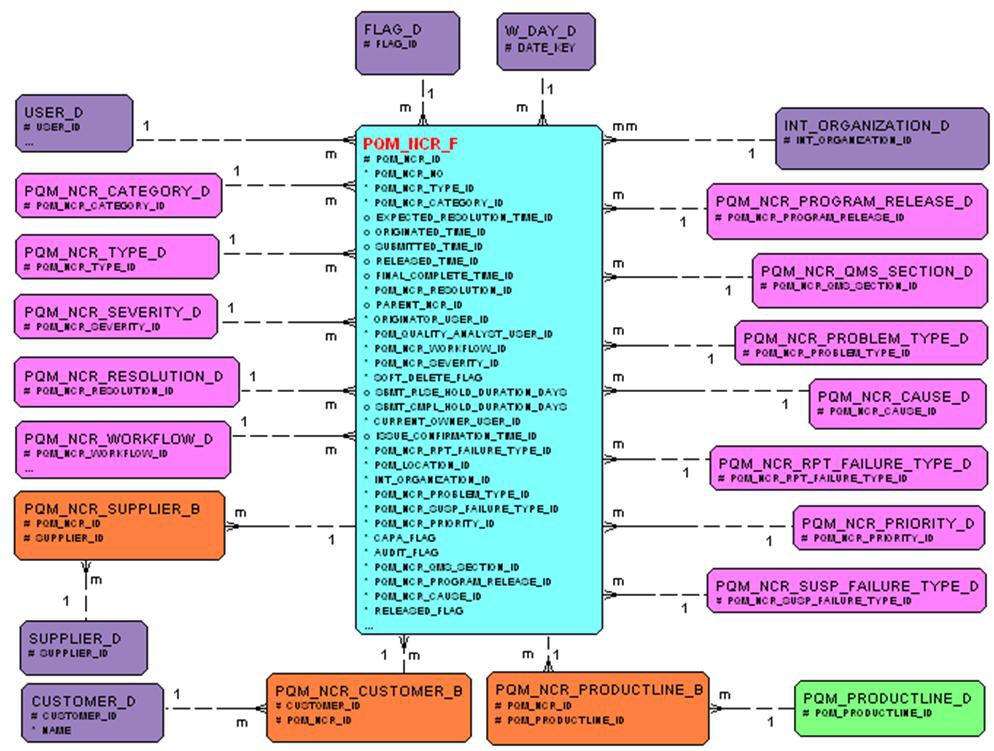
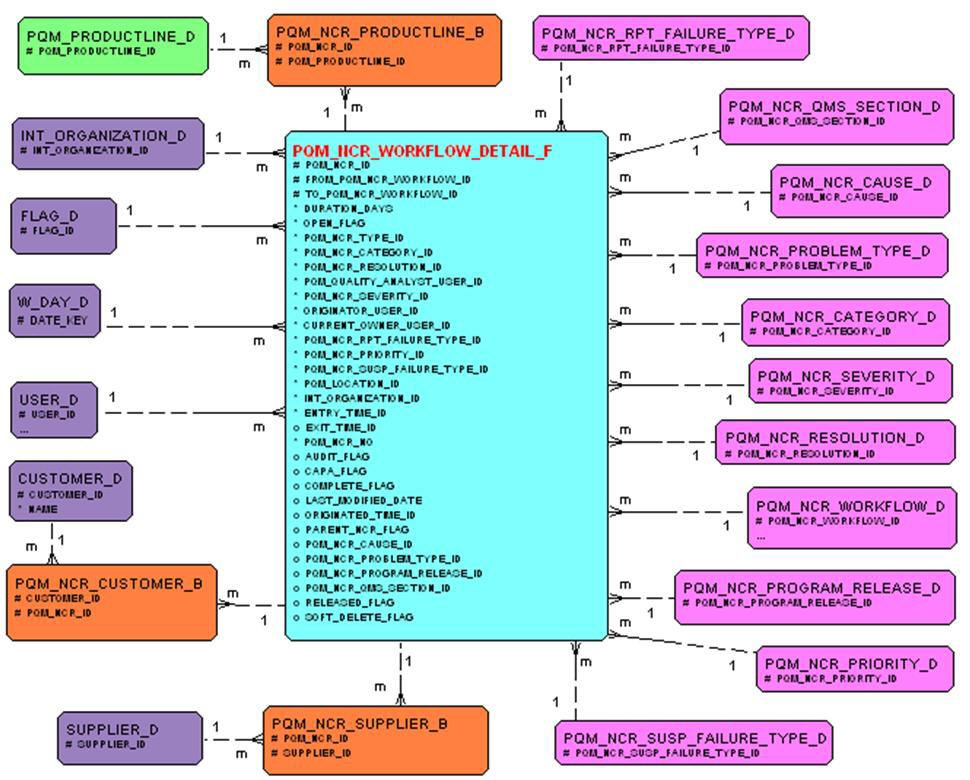
Non Conformance Reports
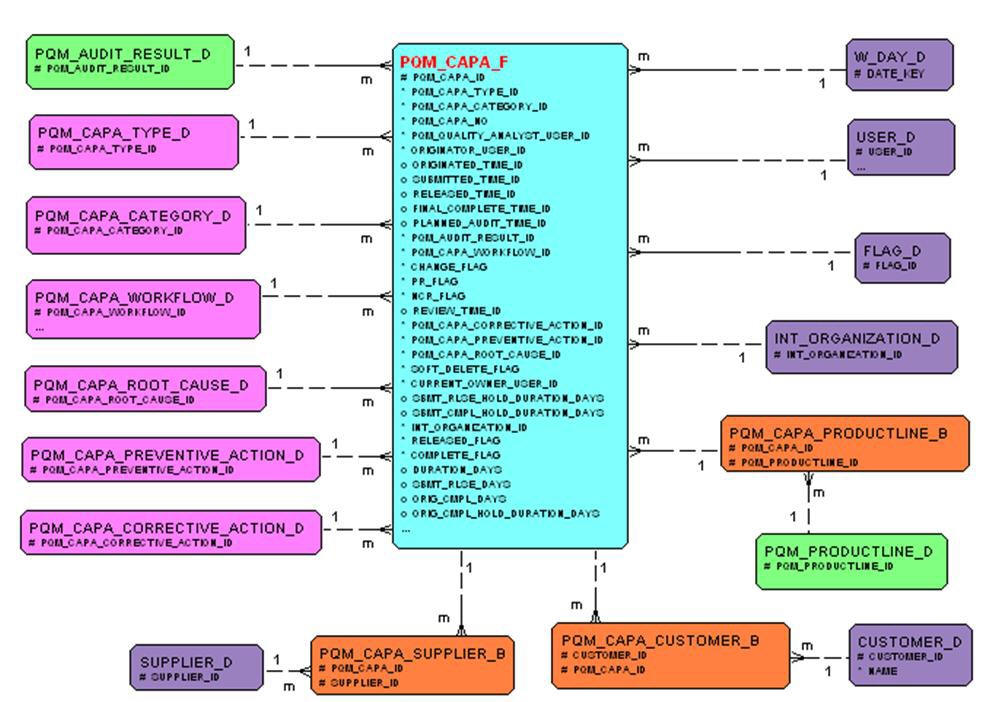
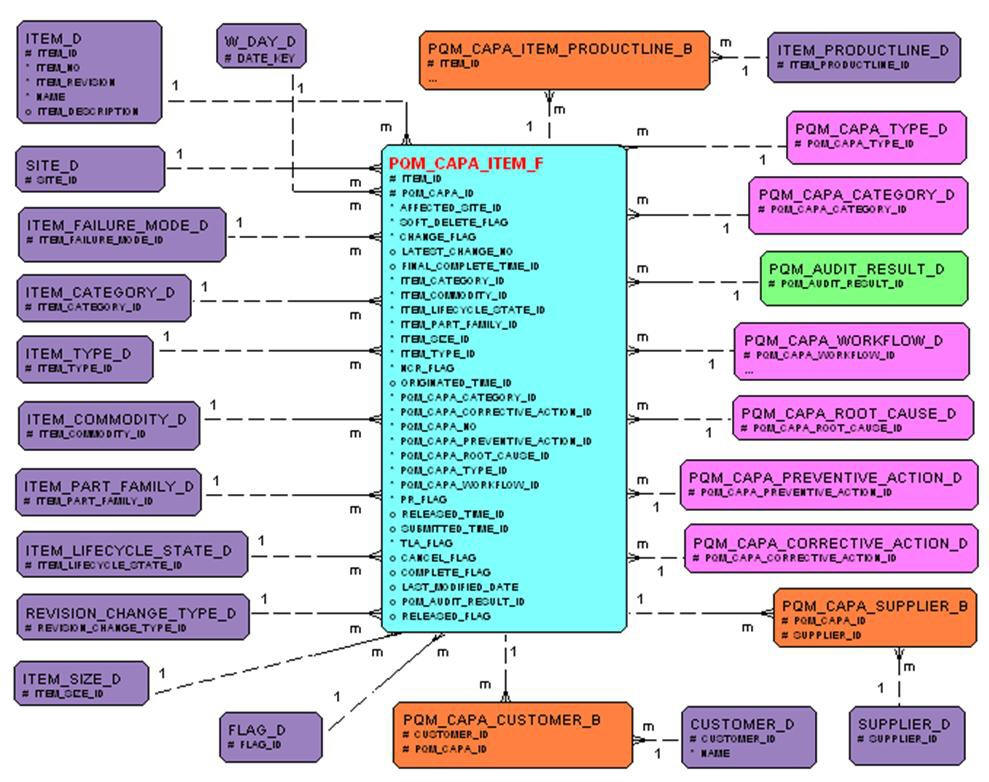
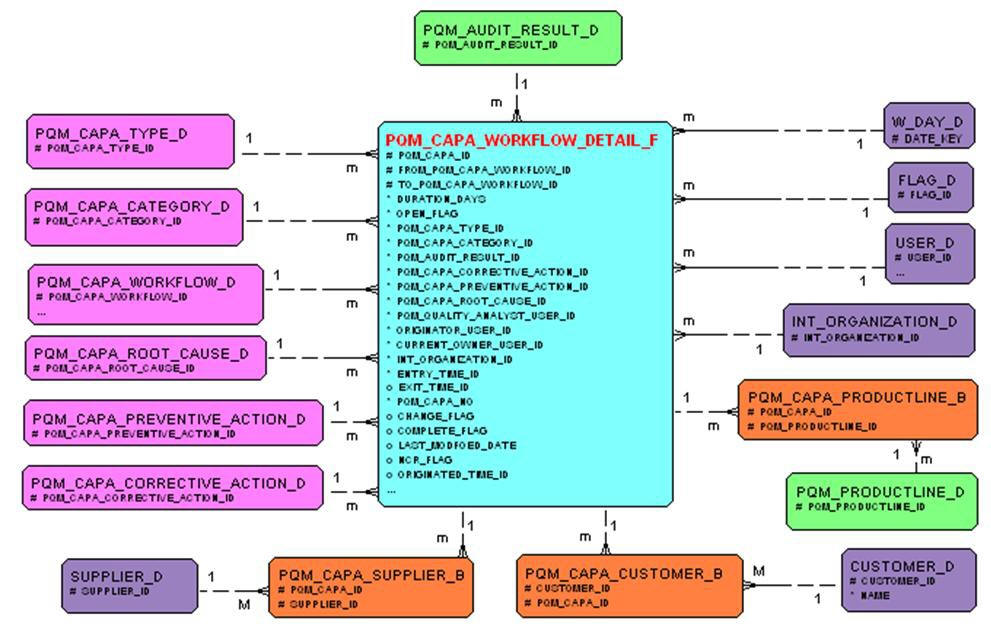
Corrective and Preventive Actions
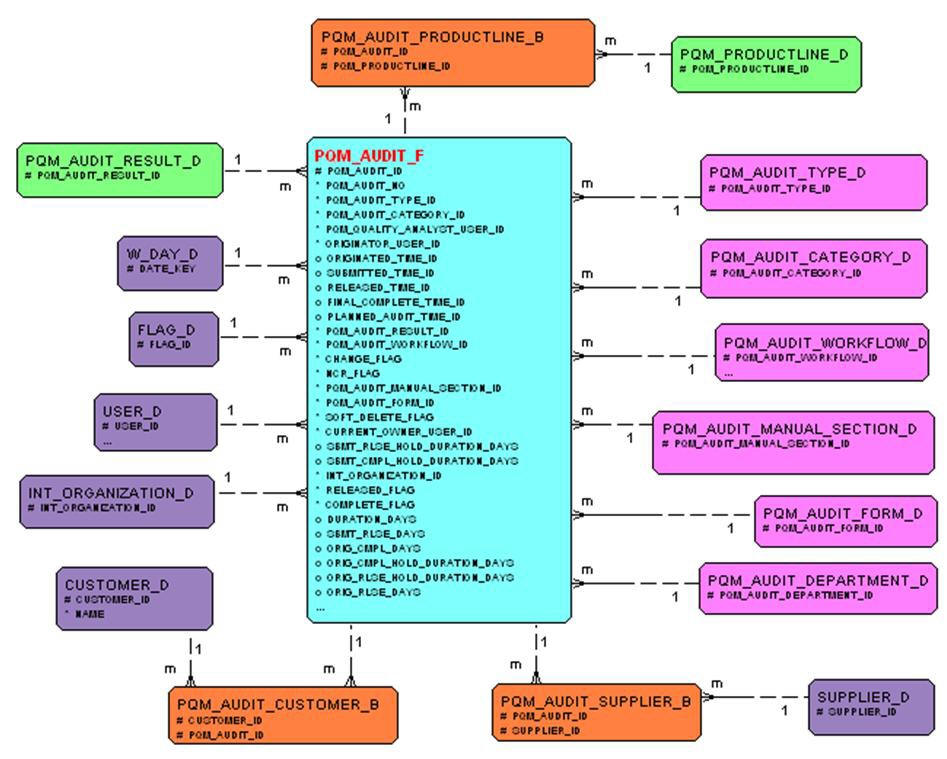
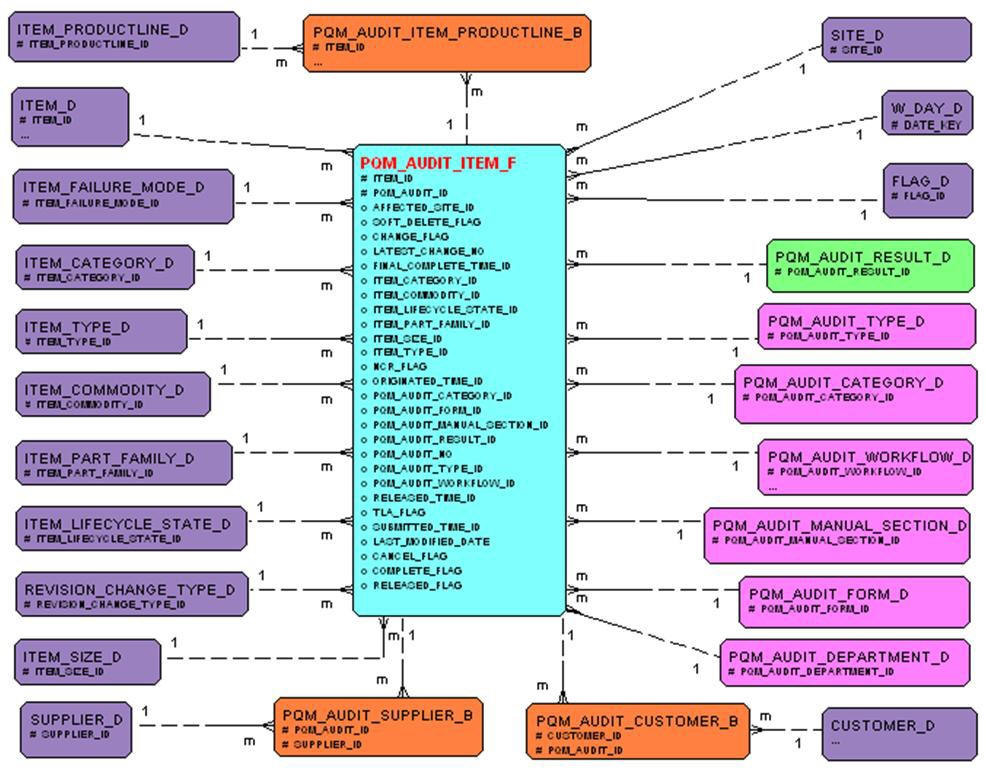
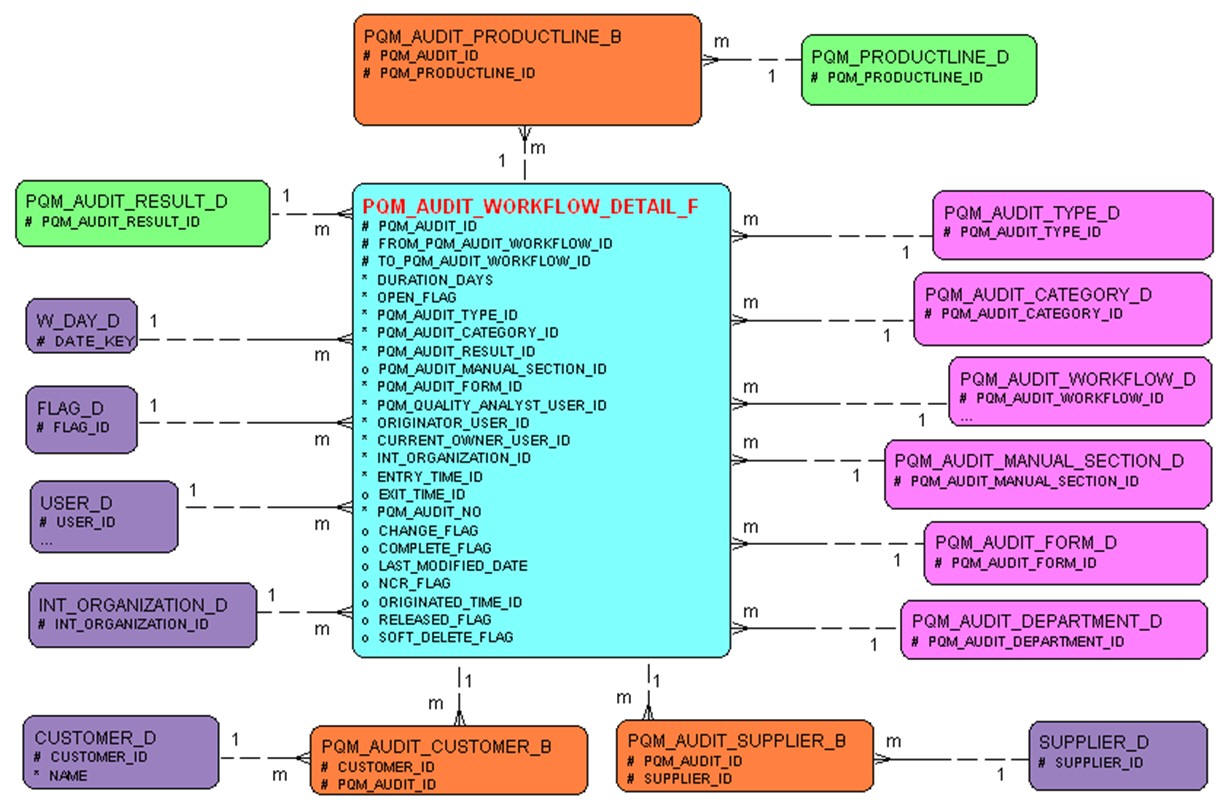
Audit
Deviations
Engineering Change Order
Engineering Change Request
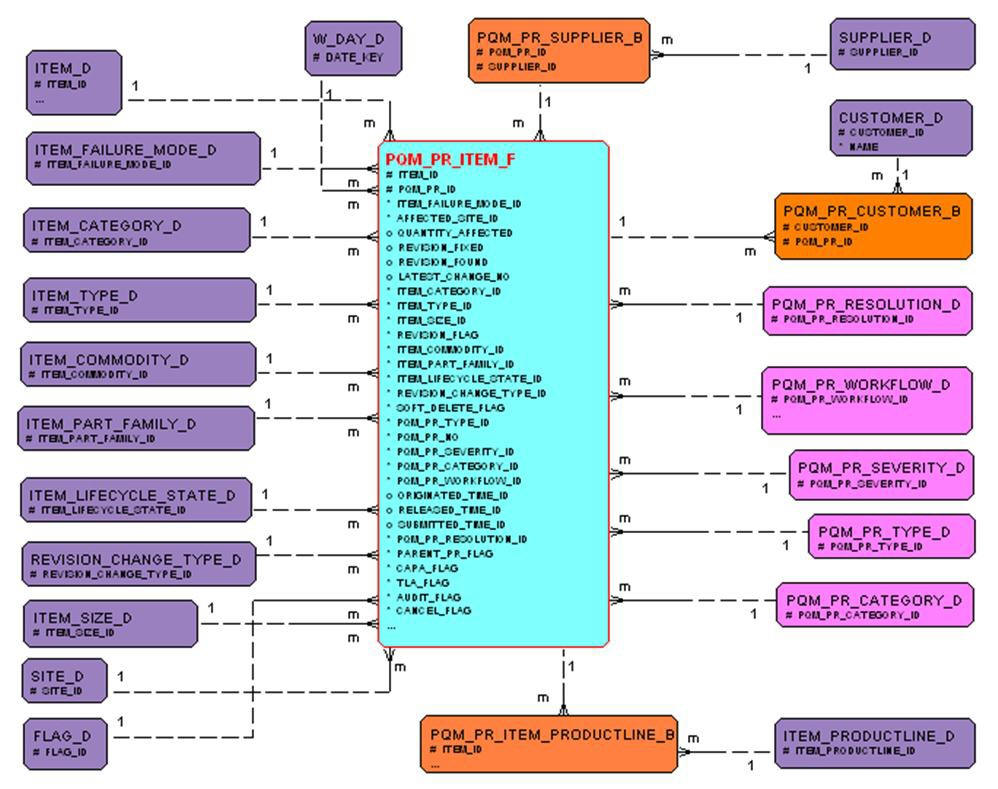
Item
Manufacturer Change Order
Stop Ship
|
Note: The tables showing P4P are applicable only when the source is Agile PLM for process. |
ER Diagrams for Agile PLM for Process Source
The ER's under the following sections are specific to only Agile PLM for Process source:
Project Metrics
Phase gate Signoff
Project Detail Workflow
Project Detail Signoff
Specifications
Specifications Workflow
The ER diagrams for the cumulative ECO fact tables are same as the ECO fact tables exceptf or the time dimension.
PC_ECO_CUM_COMP_FSCL_YEAR_F, PC_ECO_CUM_COMPLETED_YEAR_F,PC_ECO_CUM_NEW_FSCL_YEAR_F, PC_ECO_NEW_YEAR_F,
PC_ECO_CUM_REL_FSCL_YEAR_F, PC_ECO_CUM_RELEASED _YEAR_F tables are qualified with time dimension at year level.
PC_ECO_CUM_COMP_FSCL_QTR_F, PC_ECO_CUM_COMPLETED_ QTR_F,PC_ECO_CUM_NEW_ QTR_YEAR_F, PC_ECO_NEW_ QTR_F, PC_ECO_CUM_REL_FSCL_
QTR_F, PC_ECO_CUM_RELEASED _ QTR_F are qualified at the quarter level.
PC_ECO_CUM_COMP_FSCL_MONTH_F, PC_ECO_CUM_COMPLETED_ MONTH_F, PC_ECO_CUM_NEW_ QTR_ MONTH_F,PC_ECO_NEW_ MONTH_F,
PC_ECO_CUM_REL_FSCL_ MONTH_F,PC_ECO_CUM_RELEASED _ MONTH_Fare qualified at month level.
PC_ECO_CUM_COMP_FSCL_WEEK_F, PC_ECO_CUM_COMPLETED_ WEEK_F, PC_ECO_CUM_NEW_ QTR_ WEEK_F, PC_ECO_NEW_ WEEK_F, PC_ECO_CUM_REL_FSCL_
WEEK_F, PC_ECO_CUM_RELEASED _ WEEK_F are qualified at week level.