B STA Predefined Templates
This section includes short descriptions of the predefined templates for each Overview, Analysis, and Messages screen. STA predefined templates are always prefixed "STA–".
Home Tab
Tape System Hardware Tab
Tape System Activity Tab
Dashboard Templates
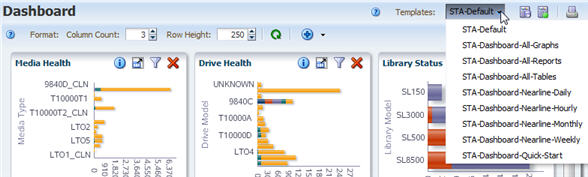
Description of the illustration ''t_dash.jpg''
- STA-Default
-
Provides a comprehensive summary of the condition, configuration, and daily performance of your tape library system.
- STA-Dashboard-All-Graphs
-
Displays all available graph portlets in alphabetical order. This template is useful for selecting portlets to include in Dashboard templates and Executive Reports.
- STA-Dashboard-All-Reports
-
Displays all available report portlets in alphabetical order. This template is useful for selecting portlets to include in Dashboard templates and Executive Reports.
- STA-Dashboard-All-Tables
-
Displays all available table portlets in alphabetical order. This template is useful for selecting portlets to include in Dashboard templates and Executive Reports.
- STA-Dashboard-Nearline-Daily
-
Displays daily summary information for drive and media activity in your tape library system over the last 30 days. The displayed portlets summarize mount activity, I/O throughput, drive and media utilization, and drive and media slot availability.
Note:
Data displayed in this template is updated at the end of each day. For bar charts, at least one full day's worth of data must have been collected by STA in order for data to be displayed. For line graphs, at least two data points are required, so at least two days' worth of data are required. - STA-Dashboard-Nearline-Hourly
-
Displays hourly summary information for drive and media activity in your tape library system over the last four days. The displayed portlets summarize mount activity, I/O throughput, drive and media utilization, and drive and media slot availability.
Note:
Data displayed in this template is updated at the end of each hour. For bar charts, at least one full hour's worth of data must have been collected by STA in order for data to be displayed. For line graphs, at least two data points are required, so at least two hours' worth of data are required. - STA-Dashboard-Nearline-Monthly
-
Displays monthly summary information for drive and media activity in your tape library system over the last 365 days. The displayed portlets summarize mount activity, I/O throughput, drive and media utilization, and drive and media slot availability.
Note:
Data displayed in this template is updated at the end of each month. For bar charts, at least one full month's worth of data must have been collected by STA in order for data to be displayed. For line graphs, at least two data points are required, so at least two months' worth of data are required. - STA-Dashboard-Nearline-Weekly
-
Displays daily summary information for drive and media activity in your tape library system over the last 100 days. The displayed portlets summarize mount activity, I/O throughput, drive and media utilization, and drive and media slot availability.
Note:
Data displayed in this template is updated at the end of each week. For bar charts, at least one full week's worth of data must have been collected by STA in order for data to be displayed. For line graphs, at least two data points are required, so at least two weeks' worth of data are required. - STA-Dashboard-Quick-Start
-
Displays information about the overall configuration and condition of the tape library system; used with the STA Quick Start Guide.
Complexes Overview Templates
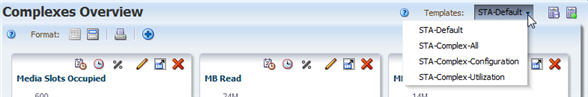
Description of the illustration ''t_libcmpx.jpg''
- STA-Default
-
Displays basic library complex configuration.
- STA-Complex-All
-
Displays all library complex graphs and table attributes.
- STA-Complex-Configuration
-
Displays information about the library complex physical and partition configuration.
- STA-Complex-Utilization
-
Displays the physical configuration of the library complex and summarizes activity in the complex, including enters and ejects, mounts and dismounts, and drive utilization.
Libraries – Overview Templates
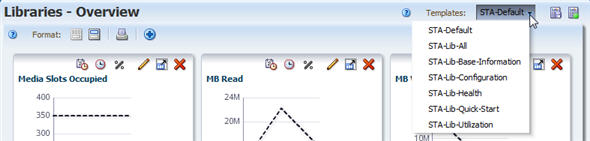
Description of the illustration ''t_libovw.jpg''
- STA-Default
-
Displays basic library properties and configuration information.
- STA-Lib-All
-
Displays all library table attributes.
- STA-Lib-Base-Information
-
Displays the base library configuration and relatively static data; useful for library description and inventory listings.
- STA-Lib-Configuration
-
Displays information about the library physical and partition configuration. Also includes connection information useful for troubleshooting connection issues.
- STA-Lib-Health
-
Displays information about library health, firmware, and SNMP connection with STA.
- STA-Lib-Quick-Start
-
Displays information about the overall configuration and condition of the library; used with the STA Quick Start Guide.
- STA-Lib-Utilization
-
Displays summary information about the amount and rates of library activity and drive utilization.
Libraries – Messages Templates
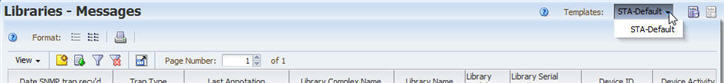
Description of the illustration ''t_libmsg.jpg''
- STA-Default
-
Displays SNMP traps, including detail about the library and device involved. Includes messages with the following Trap Types: CAP, Heartbeat, Library Environment Check, Library Log, Library Status, and PTP. Some messages may also appear in the Drives – Messages and Media – Messages screens.
Drives – Overview Templates
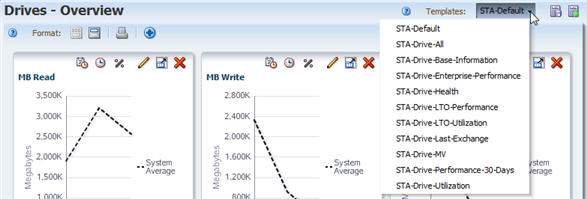
Description of the illustration ''t_drvovw.jpg''
- STA-Default
-
Displays drive configuration information and the status of the most recent exchange that occurred on the drive.
- STA-Drive-All
-
Displays all drive graphs and table attributes.
- STA-Drive-Base-Information
-
Displays the base drive configuration and relatively static data; useful for drive description and inventory listings.
- STA-Drive-Enterprise-Performance
-
Displays summary performance data for enterprise drives only.
- STA-Drive-Health
-
Displays current and summary health and activity information for all drives.
- STA-Drive-Last-Exchange
-
Displays information for the last exchange that occurred on each drive.
- STA-Drive-LTO-Performance
-
Displays performance data for LTO drives only.
- STA-Drive-LTO-Utilization
-
Displays utilization statistics for LTO drives only.
- STA-Drive-MV
-
Displays drives that meet the criteria for performing STA media validation. The displayed attributes provide detail that is useful for selecting and monitoring the performance of drives that may be assigned to the validation drive pools.
- STA-Drive-Performance-30-Days
-
Displays summary performance data for all drives over the last 30 days.
- STA-Drive-Utilization
-
Displays utilization statistics for all drives.
Drives – Analysis Templates
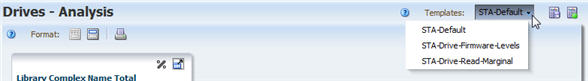
Description of the illustration ''t_drvanlys.jpg''
- STA-Default
-
Summarizes current drive health by library complex.
- STA-Drive-Firmware-Levels
-
Summarizes current drive firmware levels by drive type.
- STA-Drive-Read-Marginal
-
Summarizes the "Exchange Read Marginal" status for applicable drives, by library complex name. Applicable to StorageTek T10000 drives only.
Drives – Messages Templates
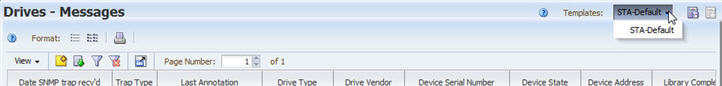
Description of the illustration ''t_drvmsg.jpg''
- STA-Default
-
Displays SNMP traps, including detail about the drive involved. Includes drive-related messages with the following Trap Types: Drive, Library Environment Check, and Library Log. Some messages may also appear in the Libraries – Messages and Media – Messages screens.
Media – Overview Templates
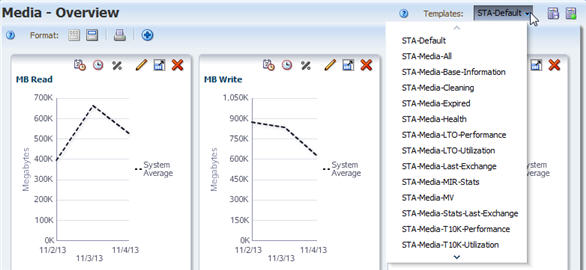
Description of the illustration ''t_medovw.jpg''
- STA-Default
-
Displays base information about the media, its most recent exchange, and the drive involved.
- STA-Media-All
-
Displays all media graphs and table attributes.
- STA- Media-Base-Information
-
Displays the base media information and relatively static data; useful for media description and inventory listing.
- STA-Media-Cleaning
-
Displays base information about cleaning media only. Also displays the status of the cleaning media's most recent exchange and the drive involved.
- STA-Media-Expired
-
Displays information about expired media. Your Oracle support representative may ask you to use this template before submitting error log information.
- STA-Media-Health
-
Displays current and summary health and activity information for all media.
- STA-Media-Last-Exchange
-
Displays information about the last exchange for each piece of media.
- STA-Media-LTO-Performance
-
Displays summary performance information for LTO media only.
- STA-Media-LTO-Utilization
-
Displays summary utilization information for LTO media only.
- STA-Media-MIR-Stats
-
Displays data from the media information record (MIR).
- STA-Media-MV-Calibration
-
Displays detail about media assigned to the calibration media logical group, including information about the last calibration performed by the media.
- STA-Media-MV-Performed
-
Displays media that have been validated within the last 30 days. The displayed attributes provide detail about media validation operations performed on these media.
- STA-Media-Stats-Last-Exchange
-
Displays throughput and efficiency information for the last exchange for each piece of media. Your Oracle support representative may ask you to use this template before submitting error log information.
- STA-Media-T10K-Performance
-
Displays summary performance information for T10000 media only.
- STA-Media-T10K-Utilization
-
Displays summary utilization information for T10000 media only.
- STA-Media-Utilization
-
Displays summary utilization information for all media.
Media – Analysis Templates
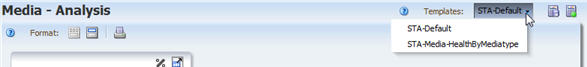
Description of the illustration ''t_medanlys.jpg''
- STA-Default
-
Summarizes current media health by library complex.
- STA-Media-HealthByMediaType
-
Summarizes current media health by media type.
Media – Messages Templates
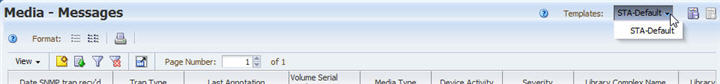
Description of the illustration ''t_medmsg.jpg''
- STA-Default
-
Displays SNMP traps, including detail about the media involved. Includes media-related messages with the following Trap Types: Library Environment Check and Library Log. Some messages may also appear in the Libraries – Messages and Drives – Messages screens.
Robots Overview Templates
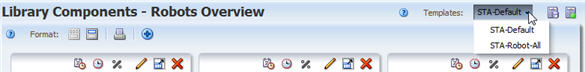
Description of the illustration ''t_robotovw.jpg''
- STA-Default
-
Displays properties and activities for all library robots.
- STA-Robot-All
-
Displays all available data attributes for all library robots.
CAPs Overview Templates
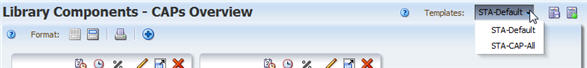
Description of the illustration ''t_capovw.jpg''
- STA-Default
-
Displays properties and activities for all library cartridge access ports (CAPs), SL3000 Access Expansion Modules (AEMs), and SL150 mailslots.
- STA-CAP-All
-
Displays all available data attributes for all library CAPs, SL3000 AEMs, and SL150 mailslots.
PTPs Overview Templates
Description of the illustration ''t_ptpovw.jpg''
- STA-Default
-
Displays properties and activities for all SL8500 library pass-thru ports (PTPs).
- STA-PTP-All
-
Displays all available data attributes for all SL8500 library PTPs.
Elevators Overview Templates
Description of the illustration ''t_elevovw.jpg''
- STA-Default
-
Displays properties and activities for all SL8500 library elevators.
- STA-Elevator-All
-
Displays all available data attributes for all SL8500 library elevators.
Alerts Overview Templates
Description of the illustration ''t_alertovw.jpg''
- STA-Default
-
Displays summary information for all STA alerts. The displayed attributes identify the alert policy, severity, criteria, and the tape library system resource or event for which the alert was generated.
- STA-Alert-All
-
Displays all available attributes for all STA alerts.
Exchanges Overview Templates
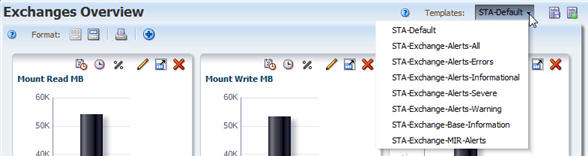
Description of the illustration ''t_libexch.jpg''
- STA-Default
-
Displays identification and status information for the drive, media, and library involved in each exchange.
- STA-Exchange-Alerts-All
-
Displays information about alerts that occurred during exchanges; exchanges that have not generated an alert are not included.
- STA-Exchange-Alerts-Errors
-
Displays all exchanges that resulted in at least one severe or warning tape alert. The displayed attributes provide detail about the types of errors that occurred. Severe tape alerts indicate an error on the exchange that may put your data at risk. Warning tape alerts indicate an error that may be associated with a hardware failure.
Your Oracle support representative may ask you to use this template before submitting error log information.
- STA-Exchange-Alerts-Informational
-
Displays all exchanges that resulted in at least one informational tape alert. The displayed attributes provide detail about the types of alerts that occurred. Informational tape alerts do not indicate an error on the exchange—cleaning alerts are an example.
- STA-Exchange-Alerts-Severe
-
Displays all exchanges that resulted in at least one severe tape alert. The displayed attributes provide detail about the types of errors that occurred. Severe tape alerts indicate an error on the exchange that may put your data at risk.
- STA-Exchange-Alerts-Warning
-
Displays all exchanges that resulted in at least one warning tape alert. The displayed attributes provide detail about the types of errors that occurred. Warning tape alerts indicate an error on the exchange that may be associated with a hardware failure.
- STA-Exchange-Base Information
-
Displays base information for all exchanges, such as drive and volume serial number, drive and media health, drive and media exchange status, MB read and written, and times.
- STA-Exchange-MIR-Alerts
-
Displays all exchanges that resulted in alerts related to the media information record (MIR). Your Oracle support representative may ask you to use this template before submitting error log information.
Drive Cleanings Overview Templates
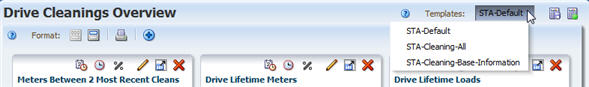
Description of the illustration ''t_drvclean.jpg''
- STA-Default
-
Displays identification and status information for the drive, media, and library involved in each cleaning exchange.
- STA-Cleaning-All
-
Displays all cleaning exchange attributes.
- STA-Cleaning-Base-Information
-
Displays base information for all cleaning exchanges, such as drive and volume serial number, drive lifetime cleans, and current and maximum cleaning uses.
Media Validation Overview Templates
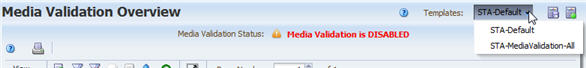
Description of the illustration ''t_mvovw.jpg''
- STA-Default
-
Displays summary information for all media validation requests. The displayed attributes identify the request state, verification test, initiator, and policy name, if applicable. Validation results for completed validations are shown, including recommended action for requests with issues.
- STA-MediaValidation-All
-
Displays all available attributes for all media validations.
All Messages – Overview Templates
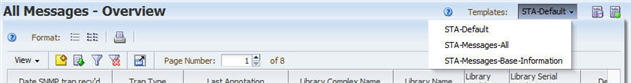
Description of the illustration ''t_notifovw.jpg''
- STA-Default
-
Displays SNMP traps, including detail about the library and device involved.
- STA-Messages-All
-
Displays all attributes available for SNMP traps (no graphs are available for this screen).
- STA- Messages-Base-Information
-
Displays base data for SNMP traps; useful for an overview, description, and listing of STA messages.
All Messages – Analysis Templates

Description of the illustration ''t_notifanlys.jpg''
- STA-Default
-
Summarizes STA message severity levels by library complex.