The Alarm History Report displays historical alarm information.
To view the alarm history report:
Alarms contain the following information:
- Occurrence
The most recent time this alert was triggered.
- SeverityThe severity of the alert:
- Critical—Service is being interrupted (displays in red).
- Major—Service may be interrupted if the issue is not corrected (displays in orange).
- Minor—Non-service affecting fault (displays in yellow).
- Info—Informational message only.
- Clear—Alarm has been cleared.
Note: Alarms generated by Policy Management systems running software lower than release 7.5 are mapped to these levels as follows: Emergency or Critical map to Critical; Alert or Error map to Major; Warning or Notice map to Minor. - Alarm ID
When clicked, the alarm ID provides online help information.
- Text
User-readable text of the alert.
- OAM VIP
OAM IP address in IPv4 or IPv6 format.
- Server
Name and IP address, in IPv4 or IPv6 format, or FQDN of the device from which this alarm was generated.
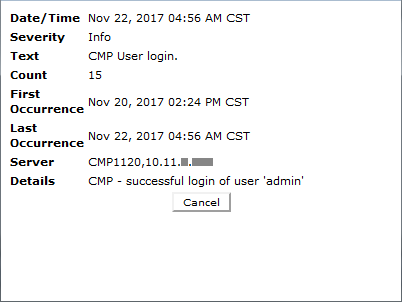
To view alert details, click ![]() (binoculars icon), located to the right of the alert. A window displays additional information.
(binoculars icon), located to the right of the alert. A window displays additional information.
For example:
Alert Details