36.6 Viewing the Rack Information
The rack information screen is divided into two parts. The top region consists of dashlets that provide you a general overview of the system. The main region displays more detailed information of the rack.
The dashlets are grouped by three into one or more series that can be switched using navigation buttons.
The first dashlet in the first series displays the summary of the rack, including the serial number of the rack, total number, and number of occupied slots. It also displays the location of the rack if the information is available.
The second dashlet in the first series displays number of open incidents relayed on the rack and all the targets in the rack. Click on one of the displayed numbers to view the list of the incidents of a given severity.
The third dashlet in the first series displays the current (in Ampere) usage per phase of the rack.
The first dashlet in the second series displays the number of targets that are online, offline, and aggregated number of targets in any other status.
The second dashlet in the second series displays the occupancy of the rack. It displays the slot occupancy and PDU occupancy of the rack in a graphical representation.
The third dashlet in the second series displays the last configuration changes made to the rack.
Note:
Click the Second dashlet series icon (displayed below the dashlets) to view more dashlets. Click the First dashlet series icon to view the first set of dashlets.
36.6.1 Physical View of the Rack
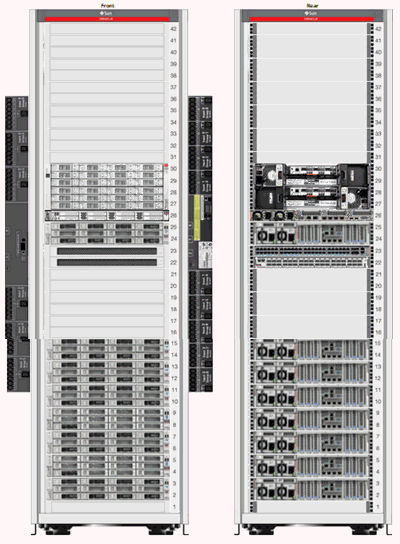
Click the first tab in the main section of the rack landing page for a physical view of the rack. Photorealistic view of the rack displays the rack and it's content providing an overview of how the targets are placed into the rack. You can click on any of the targets in the rack to view more detailed information about the selected targets. Click on the rack to view the information about the rack itself. You can switch between several representations of the physical view.
-
Photorealistic view provides a realistic picture of the system with detailed graphics of all the components.
-
Schematic view is data oriented and displays the most important information such as locator light, status, temperature, and host name. Each component in the view has its color based on the type for easy identification of the component. Click Show Temperature option on the right side to view the temperature of targets that provide that information. To place targets into the empty slots, check the Empty Slot option below the Temperature toggle. If unchecked, the empty slots are not active.
-
Table view is a tabular representation of the physical view, providing a list of displayed components with the most important information.
Figure 36-3 Photorealistic View of the Rack

Description of "Figure 36-3 Photorealistic View of the Rack"
36.6.2 Firmware View
Click the second tab in the main section of the rack landing page to display the Firmware view. Firmware View displays a tabular view of all the firmware of targets placed in the rack. It displays the Target Name, Target Type, Firmware Type, and Firmware Version in a tabular format. The search option is available on the top of the table header for all columns such as Target Name, Target Type, Firmware Type, and Firmware Version. In the Target Type search field, select the type of target from the drop-down list.You can enter a firmware type in the firmware search field to view targets with the selected firmware type only.
36.6.3 Load View
Load View displays detailed information of the load of the PDUs in the rack. It displays a graphical view of the PDU phase load per module where the time history of the PDU phase load is displayed.