Auditing Data Cubes at Design Time
This topic provides an overview of auditing data cubes at design time.
Note: Use the Analytic Model Viewer to audit cube collections and data cubes in runtime.
Any data cube that affects another data cube is a cause or precedent of that data cube. A data cube can be a direct cause or an indirect cause of another data cube. A direct cause is used in the data cube's formula. An indirect cause is not used in the formula, but it appears somewhere in the chain of formulas that ultimately affect the data cube.
For example, suppose the GROSS_MARGIN and NET_INCOME data cubes contain these formulas:
Formula for the GROSS_MARGIN data cube:
SALES - COST_OF_GOODSFormula for the NET_INCOME data cube:
GROSS_MARGIN - TOTAL_EXPENSE
In this example, SALES is a direct cause of GROSS_MARGIN because it is used in GROSS_MARGIN's formula. SALES is an indirect cause of NET_INCOME because it affects GROSS_MARGIN, which in turn affects NET_INCOME.
You can display the causes of a data cube to view the assumptions behind a result or to find a formula that is not working properly.
Using the All Inputs option, you can also display all of the input data cubes that affect a data cube, either directly or indirectly.
Any data cube that is affected by another data cube is an effect or dependent of that data cube. A data cube can be a direct effect or an indirect effect of another data cube. A direct effect uses the data cube in its formula. An indirect effect does not use the data cube in its formula, but it is part of the chain of calculations that are affected by the data cube.
Again, suppose the GROSS_MARGIN and NET_INCOME data cubes contain these formulas:
Formula for the GROSS_MARGIN data cube:
SALES - COST_OF_GOODSFormula for the NET_INCOME data cube:
GROSS_MARGIN - TOTAL_EXPENSE
GROSS_MARGIN is a direct effect of SALES because it uses SALES in its formula. NET_INCOME is an indirect effect of SALES because it is affected by GROSS_MARGIN, which in turn is affected by SALES.
You can display either the direct or direct plus indirect effects of a data cube to view the consequences of a data cube's values.
To display the causes or inputs of a data cube:
Select to access PeopleSoft Application Designer.
After signing in to the PeopleSoft Application Designer, open an analytic model definition.
Select a data cube whose causes or inputs you want to display.
To select several consecutive data cubes, hold down the Shift key and select the data cubes.
To select a series of nonconsecutive data cubes, hold down the Ctrl key and select the data cubes.
Select
Select one of these options:
Direct Causes.
All Causes.
All Inputs.
When applicable, the Causes and Effects dialog box displays the causes or inputs of the data cube. You expand any of the data cubes in the dialog box to view their attached dimensions.
Note: The All Inputs option does not display the INPUT built-in function.
Click the Close button when you have finished viewing the causes or inputs.
Note: You can also display causes and inputs by selecting
To display the effects of a data cube:
Select to access PeopleSoft Application Designer.
After signing in to the PeopleSoft Application Designer, open an analytic model definition.
Select a data cube whose effects you want to display.
To select several data cubes, hold down the Ctrl key and select the data cubes.
Select
Select one of these options:
Direct Effects.
All Effects.
The Causes and Effects dialog box displays either the direct effects or all (direct and indirect) effects of the data cube. You expand any of the data cubes in the dialog box to view their attached dimensions.
Click the OK button when you have finished viewing the effects.
Note: You can also display effects by selecting
To use the Causes and Effects Tool option:
Select to access PeopleSoft Application Designer.
After signing in to the PeopleSoft Application Designer, open an analytic model definition.
Select to browse through the cube collections and data cubes of your analytic model to view the causes, effects, and inputs of data cubes.
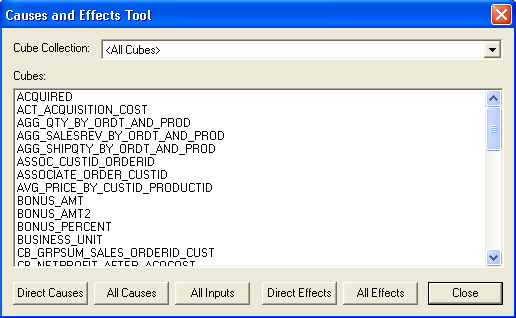
Image: Example of the Causes and Effects Tool dialog box
This is an example of the Causes and Effects Tool dialog box.
|
Field or Control |
Definition |
|---|---|
| Cube Collection |
Select the cube collection to display a list of its data cubes. Note: You can also select <All Cubes> to display a list of all data cubes in the analytic model. |
| Cubes |
Displays the names of the data cubes in the selected cube collection or the analytic model. Select a data cube to view its causes, inputs, or effects. To select several data cubes, hold down the Ctrl key and select the data cubes. |
Note: You can also audit individual data cubes by selecting the data cube, and then selecting and the desired audit option from the menu bar.