Setting Analytic Grid Analytic Properties
To set analytic grid Analytic properties:
Select to access PeopleSoft Application Designer.
After signing in to the PeopleSoft Application Designer, open a page definition.
Select to add a analytic grid.
Access the Analytic Grid Properties dialog box by double-clicking anywhere on the analytic grid other than on the column headings.
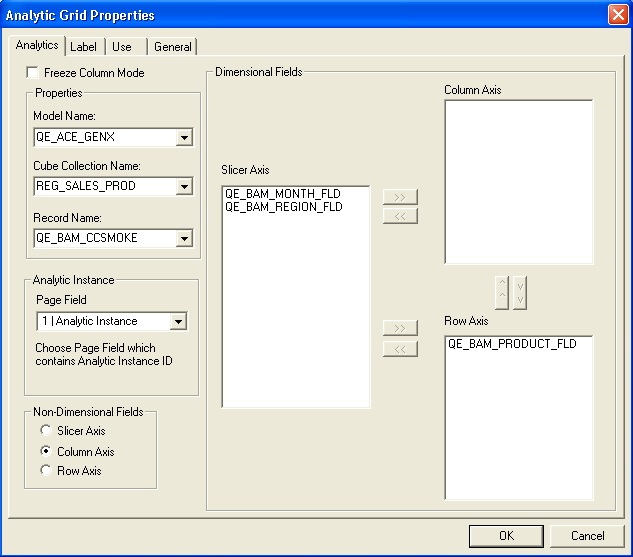
Use the Analytics tab to set analytic model association and axis display properties.
Image: Analytic Grid Properties dialog box - Analytics tab
This example illustrates the fields and controls on the Analytic Grid Properties dialog box - Analytics tab. Definitions for the fields and controls appear following the example.
|
Field or Control |
Definition |
|---|---|
| Freeze Column Mode |
Select this check box if you want to freeze the columns of the grid when it's displayed to the end user. If you select this check box, the only enabled field in the dialog box is the Record Namefield. |
| Model Name |
Select the analytic model that you want to associate with the current analytic grid. You can select from any of the analytic models in the database. |
| Cube Collection Name |
Select a cube collection from the analytic model. Note: This drop-down list box only displays presentation cube collections, which have work/derived records associated with them. Any other cube collections do not appear. |
| Record Name |
Select either a main record or an aggregate record from the cube collection. The aggregate record is selected by default, if applicable. If there's no aggregate record, this field is populated with the main record. If you've selected the Freeze Column Mode check box, only work/derived records are displayed. |
| Analytic Instance |
Specify the page field containing the analytic instance ID—that is, the instance of the analytic model that is displayed in this analytic grid. |
| Non-Dimensional Fields |
Select Slicer Axis to set the non-dimensional fields axis to the slicer axis. Select Column Axis to set the non-dimensional fields axis to the column axis. Select Row Axis to set the non-dimensional fields axis to the row axis. Warning! All fields that are mapped to dimensions are considered dimensional fields. All fields that are mapped to data cubes are considered non-dimensional fields. The non-dimensional fields referred to within this dialog box are mapped to data cubes. However, any field that is not mapped to anything is also considered a non-dimensional field. If the application developer wants to include such non-dimensional fields (those not mapped to anything) with the analytic grid, he or she must populate them using the RowInit method or their value will be zero. Note: If a field is designated as invisible, that property is sometimes honored and sometimes not honored within the analytic grid. If the field is a dimension on the slicer axis, the property is honored. If the field is a dimension on the row or column axis, the invisible property is not honored. If the field is a cube, the invisible property is honored on the column but not the row axis. |
| Dimensional Fields |
Use the Slicer Axis option to set which dimensional fields are used for the slice bar. Dimensions that have filter functions applied will behave differently depending on whether they reside on the column axis/row axis or the slice bar. See the following for details. Use the Column Axis option to set which dimensional fields are used for the column axis. Use the Row Axis option to set which dimensional fields are used for the row axis. You can select any dimensional field and move it from one list box to another by using the appropriate arrow keys. (The arrow keys are grayed out if you do not have a field selected.) The order of the fields on any particular axis—as end users will see it—is determined by the order in which their columns appear in the analytic grid, not by their order in the analytic model. You can change the column order by using drag and drop. By default, all but the last dimension appear on the slice bar axis; the last dimension appears on the row axis, and the data cubes appear on the column axis. |