Monitoring Batch Programs
This section provides an overview of batch program monitoring tools.
This section discusses the utilities provided by PeopleSoft and IBM to monitor and help you tune the performance of PeopleSoft batch programs.
|
Utility |
Description |
|---|---|
|
SQL Trace - Client |
This PeopleSoft client utility records the actual SQL statements that PeopleTools and batch COBOL send to the database, along with their relative processing times. This trace can increase response time significantly. |
|
DB2 CLI/ODBC Trace |
The DB2 CLI/ODBC trace is a trace provided by IBM that can be very helpful in debugging DB2 Connect problems. For PeopleSoft, this trace can be very useful for tracking down problems when running client COBOL or AE. It can also be used for debugging the PeopleSoft on-line as well. Like many of these other traces, enabling this trace slows processing down and results in large output files on the client. |
|
PTPSQLRT Statistics Report |
The PeopleSoft COBOL API, PTPSQLRT, provides a report called “PTPSQLRT Statistics” that shows frequency and elapsed times for SQL statements executed in batch processing. This report provides you with an effective and easy-to-use tool to monitor and evaluate SQL performance. No DBA involvement is required, and impact on batch performance is negligible. This report can track both client or mainframe COBOL. For client COBOL, you enable this report by selecting a SQL Trace option. On the mainframe, you modify the JCL to set the trace option to Y. |
|
Dynamic Explains |
The PTPSQLRT API program allows you to capture access path information of the SQL statements executed during batch processing. This information can help you tune any problem queries identified by the Timings Statistics Report. |
|
Parallelism |
The PTPSQLRT API program allows you to capture access path information of the SQL statements executed during batch processing. This information can help you tune any problem queries identified by the Timings Statistics Report. |
|
Parallelism |
You can specify the degree of parallelism for the execution of queries that are dynamically prepared by the application process. |
|
SQL Trace - Server |
You can run a PeopleSoft SQL trace on the z/OS server that displays similar results as the SQL Trace on the client. You can see SQL times, return codes and SQL that is executed. |
|
SQR flag |
You can use the |
The DB2 CLI/ODBC trace can be enabled directly in the DB2CLI.INI directly or using the Client Configuration Assistant.
When updating the DB2CLI.INI directly, these are the recommended settings for enabling Trace:
[COMMON]
TRACEFLUSH=1
TRACEPATHNAME=C:\TEMP\DB2TRACE\
(or use TRACEFILENAME=C:\TEMP\filename to direct to file)
TRACECOMM=1
TRACE=1 (trace=0 turns the trace OFF)
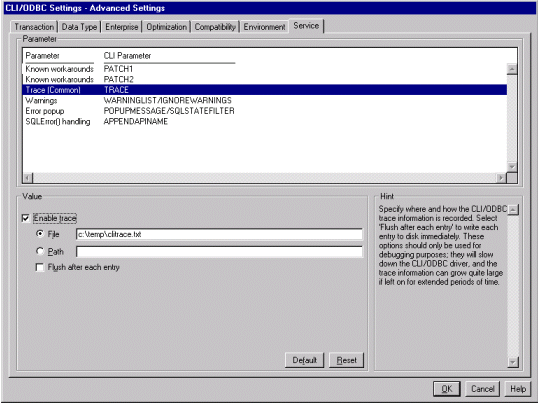
TRACEREFRESHINTERVAL=60Or you can enable the trace, with the same options, using the Service tab in Client Configuration Assistant.
Image: DB2 UDB Client Configuration Assistant
This example illustrates the fields and controls on the Service tab in Client Configuration Assistant for DB2 UDB.
Control over enabling and disabling Statistics Reports on the z/OS batch server is now done primarily through the PSOS390 Process Scheduler configuration. The JCL shell SHELCBL.JCT file located in the /u/datax/psvvv/appserv/prcs/process_scheduler_name/shelljcl directory on USS contains symbolic variables for each parameter that is resolved by Process Scheduler when a COBOL job is submitted. As an option, you can replace the symbolic with the "hard coded" value of Y to enable or N to disable the particular parameter. The section in the JCL shell appears as follows:
//* PARMFILE - PARM 1 IS OPRID - LEAVE AS SYMBOLIC
//*            PARM 2 IS RUN CONTROL NAME
//*            PARM 3 IS A YES/NO SWITCH FOR PERFORMANCE STATISTIC
//*           PARM 4 IS PROCESS INSTANCE; 0 TRIGGERS PROC INST LOGIC
//*            BLANK IF NON-PROCESS SCHEDULER JOB
//*            PARM 5 IS A YES/NO SWITCH FOR DYNAMIC EXPLAINS
//*            PARM 5 REQUIRES THAT PARM 3 IS SET TO YES
//*          PARM 6 IS A YES/NO SWITCH TO ENABLE PARALLEL PROCESSING
//*            PARM 7 IS A YES/NO SWITCH TO ENABLE SQL TRACE
//*            PARM 8 IS A YES/NO SWITCH TO ENABLE RUN STATISTICS
//*         PARM 9 IS A REMOTE-CAL INDICATOR - ALWAYS "BATCH" IN JCL
//*            PARM 10 IS THE FULL DIRECTORY PATH OF PS_HOME
//*            PARM 11 IS THE FULL DIRECTORY PATH OF PS_SERVDIR
//*            PARM 12 IS THE FULL PATH OF THE PROCESS SCHEDULER
//*              CONFIGURATION FILE
//*            PARM 13 IS THE USERID WITH FULL AUTHORIZATION IN USS
//*             OF ALL HFS DIRECTORY WHERE AE WILL WRITE THE LOGS TO
//*            PARM 14 IS THE JCL JOB NAME
//*            PARM 15 IS THE REGION SIZE SETTING (DEFAULT IS -1)
//*         PARM 16 IS THE MAX CPU TIME ALOTTED FOR AN AE SUBROUTINE
//*
//*
//******************************************************************
//*  NOTE  ON ENABLE RUN STATISTICS:  IF YOU HAVE CHANGED THE
//*         SETTINGS TO RUN STATISTICS ON TABLESPACES, YOU MUST BIND
//*         THE PLAN FOR PTPSQLRT USING BINDAREP AND BINDEREP IN THE
//*        JCLLIB LIBRARY WITH THE BIND OPTION:  PKLIST (DSNUTILS.*)
//*         INCLUDED IN THE OPTIONS LIST
//*
//*         PARAMETERS 10-16 ARE REQUIRED WHEN RUNNING A COBOL
//*         PROGRAM THAT TRIGGERS AN AE SUBROUTINE
//***********************************************************************
//*
//PARMFILE DD *
%OPRID%
%RUNID%
%PERFSTAT%
%INSTANCE%
%DYNEXPLN%
%PARALLEL%
%SQLTRACE%
%RUNSTAT%
BATCH
%PS_HOME%
%PS_SERVDIR%
%PS_SERVERCFG%
%PS_CONFIG%
%HFS_USERID%
%JOBNAME%
%REGION_SIZE%
%CPU_TIME%
/*
Viewing the PTPSQLRT Report
Timings represent elapsed (wall clock) times expressed in seconds. For example, the value 2.383 means 2 seconds, 383 milliseconds. Where a value for COUNT exists, and TIME = .000, indicates an elapsed time of less than 1 millisecond. Because the results of this report are in elapsed time, care should be taken in interpreting the results. If you are using the report to identify poorly performing SQL, then multiple executions should be analyzed and the results compared before drawing any conclusions. Further analysis requires Explains and CPU timings of possible problem statements.
STATEMENT NAME
The name associated with a single SQL statement to be executed dynamically by program PTPSQLRT. It can be either a Select, Update, Insert or Delete statement as indicated by the “S,” “U,” “I,” or “D” designation in the statement name. Each statement may be executed once, or many times during a PeopleSoft batch program.
A statement name is made up of the program name and the type of SQL DML. For example, “PSPAGERT_S_AGERT” is in program PSPAGERT and is a SELECT; AGERT is a unique name within the application.
To examine a statement’s contents, you may either:
Select * From your_id.PS_SQLSTMT_TBL Where PGM_NAME=’PSPAGERT’, STMT_TYPE=’S’ and STMT_NAME=’AGERT’
On a LAN, locate the \PS\SRC\CBL\BASE subdirectory; statements are contained in files having the “DMS” extension and a filename of program name.
RETRIEVE
Reports the number of times and total time it takes for PTPSQLRT to select SQL statement text from PS_SQLSTMT_TBL. Retrieve count of zero indicate a Dynamic Statement that is not stored in PS_SQLSTMT_TBL.
PREPARE
Reports the number of times and total time it takes PTPSQLRT to do “DECLARE CURSOR” and prepare the SQL statement.
CLOSE
Reports the number of times and total time to CLOSE an open cursor. Applies to Cursor SELECT statements only
FETCH
Reports the number of FETCHes as well as the total time spent
For example, if Count=2 and Time=.040, it means that the program issued 2 fetch statements totaling .040 seconds (40/1000), or an average of .020 per fetch. If EXECUTION Count = 1, it means 2 FETCHes were done in a single OPEN Cursor. (This is true for columns 2 through 6.)
STMT TOTALS
Shows sum of all timings for each statement, calculated by adding all TIME accumulations horizontally. Also shown under “% SQL” is the percentage of the total processing time that a particular SQL statement represents. For example, a “% SQL” time of 1.03 indicates a statement used just over 1% of all SQL processing time.
TOTAL IN SQL CALLS
Total time spent by PTPSQLRT making SQL calls (sum of all SQL activity).
TOTAL IN SQLRT STATS
Total time spent by PTPSQLRT producing statistics (Assembler calls, COBOL processing).
TOTAL IN SQLRT OTHER
Total time spent by application programs (as in PSPTCALC.CBL) processing COBOL statements.
TOTAL IN SQLRT
Total in SQL Calls + Total in SQLRT stats + Total in SQLRT other. Total time spent by PTPSQLRT (SQL, STATS, COBOL).
TOTAL IN APPL COBOL
Total time processing COBOL programs.
TOTAL IN APPL
Total in SQLRT + Total in APPL COBOL. Grand total processing of all COBOL, PTPSQLRT, and SQL processing.
TOTAL SQLRT CALLS
Total number of calls made to PTPSQLRT called by COBOL programs.
TOTAL SQLRT STATEMENTS
Total number of distinct SQL statements executed.
MAXIMUM CURSORS CONNECTED
Largest number of active concurrent connection paths to DB2 UDB during program execution; “cursor” refers not only to open cursors, but deletes, inserts and updates as well.
There are three ways to enable the statistics report generation. The following steps take you through the three possibilities.
Enabling the Statistics Report on the DB2 UDB for z/OS Server
To enable the statistics report on the DB2 UDB for z/OS server:
Initialize the PSADMIN program on Unix System Services to administer the Process Scheduler PSOS390.
You may either select Option 3 - Configure a Process Scheduler Server, or Option 6 - Edit a Process Scheduler Configuration File.
If you select Option 3, you would set the value for TraceSQL to 128.
If you select Option 6, you need to locate the related section in the file and change the TraceSQL flag to 128.
As a third option, you could chose Option 9 - Edit a Shell JCL from the PSADMIN menu and select JCL Shell shelcbl.jct (selection 1)
This brings the file up in the VI editor.
Locate the PARMFILE section in the JCL Shell, and replace the symbolic %PERFSTAT% (Performance Statistic-PARM 3) parameter with the value Y for Yes.
Save the file and stop and restart the Process Scheduler.
The Statistics Report is written to a Sequential Dataset HLQ.ppvvv.program_name.
The PTPSQLRT API program enables you to capture access path information of the SQL statements executed during batch processing. This information can help you tune any problem queries identified by the Timings Statistics Report.
Note: The Dynamic Explains feature is a performance tool for DBAs and other PeopleSoft product support personnel to be used for performance tuning. We recommend that this feature be disabled when in production mode.
There are three ways to enable generating a dynamic explain. The following steps take you through the three possibilities.
To enable Dynamic Explains in the JCL:
Initialize the PSADMIN program on Unix System Services to administer the Process Scheduler PSOS390.
You may either select Option 3 - Configure a Process Scheduler Server, or Option 6 - Edit a Process Scheduler Configuration File.
If you select Option 3, you need to set the value for TraceSQL to 256.
If you select Option 6, you need to locate the related section in the file and change the TraceSQL flag to 256.
As a third option, you could chose Option 9 - Edit a Shell JCL from the PSADMIN menu and select JCL Shell shelcbl.jct (selection 1)
This brings the file up in the VI editor.
Locate the related section in the JCL Shell, and replace both the symbolic %PERFSTAT% (Performance Statistic-PARM 3) and %DYNEXPLN% (Dynamic Explains-PARM 5) parameters with the value Y.
Save the file. It is not necessary to stop and re-start the Process Scheduler for the change in the JCL shell to take effect.
The PTPSQLRT API program provides a feature that allows you to enable DB2 UDB parallelism. If enabled, PTPSQLRT issues the following command to DB2 UDB:
SET CURRENT DEGREE = 'ANY'The CURRENT DEGREE parameter specifies the degree of parallelism for the execution of queries that are dynamically prepared by the application process. For PeopleSoft, this applies to all queries run in batch. While setting CURRENT DEGREE =ANY enables DB2 UDB parallelism, this does not necessarily mean that the statements in the application programs uses parallelism. What it means is that DB2 UDB's optimizer considers parallelism as a possible option.
There are also three ways to enable parallel processing. The following steps takes you through the three possibilities.
To enable parallelism in the JCL
Initialize the PSADMIN program on Unix System Services to administer the Process Scheduler PSOS390.
You may either select Option 3 - Configure a Process Scheduler Server, or Option 6 - Edit a Process Scheduler Configuration File.
If you select Option 3, you need to set the value for Enable Parallel Processing to 1.
If you select Option 6, you need to locate the related section in the file and change the Enable Parallel Processing flag to 1.
As a third option, you could chose Option 9 - Edit a Shell JCL from the PSADMIN menu and select JCL Shell shelcbl.jct (selection 1).
This brings the file up in the VI editor.
Locate the section in the JCL Shell, and replace the symbolic %PARALLEL% (Parallel Processing-PARM 6) parameter with the value Y.
Save the file. It is not necessary to stop and re-start the Process Scheduler for this change to be recognized.
The PTPSQLRT API program enables you to capture a PeopleSoft SQL trace. This trace has been improved in PeopleSoft 8 to mirror the familiar SQL trace used on the client. The functionality of this trace has been improved to include all dynamic SQL statements that have been captured in the past by the DYSQLOG trace.
Note: The SQL Trace feature is a tool for DBAs and other PeopleSoft product support personnel to use for performance tuning. We recommend that this feature be disabled in production mode.
There are three ways to enable the SQL Trace. The following steps take you through the three possibilities.
To enable PeopleSoft SQL trace in the JC:
Initialize the PSADMIN program on Unix System Services to administer the Process Scheduler PSOS390.
You may either select Option 3 - Configure a Process Scheduler Server, or Option 6 - Edit a Process Scheduler Configuration File.
If you select Option 3, you need to set the value for TraceSQL to 1.
If you select Option 6, you need to locate the related section in the file and change the TraceSQL flag to 1.
As a third option, you could chose Option 9 - Edit a Shell JCL from the PSADMIN menu and select JCL Shell shelcbl.jct (selection 1).
This brings the file up in the VI editor.
Locate the section in the JCL Shell, and replace the symbolic %SQLTRACE% parameter with the value Y.
Save the file. If you originally configure the Process Scheduler with “Allow Dynamic Changes = Y” it isn't necessary to stop and re-start the Process Scheduler for this change to take effect.
The following is Sample PeopleSoft SQL trace from z/OS output queue:
Elapsed     SQL
    Time       Time  Crsr Return  DB API Statement
    ------    ------ ---- ------  ----------------
     0.044     0.044      RC=   0 CEX Stmt=SELECT OWNERID FROM PSSTATUS
     0.000     0.000      RC=   0 CEX Stmt=SET CURRENT SQLID = 'PT800RB'
     0.000     0.000      RC=   0 CEX Stmt=SET CURRENT DEGREE= '1'
     0.039     0.029      RC=   0 GETSTMT Stmt=PTPRUNID_U_UPDID
     0.003     0.002 #001 RC=   0 Prepare=UPDATE PS_PRCSSYSTEM SET
 LASTPRCSINSTANCE = LASTPRCSINSTANCE + 1
     0.013     0.000 #001 RC=   0 Execute
     0.013     0.000 #001 RC=   0 Row Count=000000001
     0.000     0.000      RC=   0 GETSTMT Stmt=PTPRUNID_S_GETID
     0.002     0.002 #001 RC=   0 COM=SELECT LASTPRCSINSTANCE FROM PS_PRCSSYSTEM
     0.006     0.000 #001 RC=   0 SSB=0001 TYPE=SQLPSLO LEN=0004
     0.000     0.000 #001 RC=   0 Execute
     0.000     0.000 #001 RC=   0 Fetch
     0.002     0.000 #001 RC=   0 Commit
     0.011     0.000      RC=   0 GETSTMT Stmt=PTPLOGMS_S_OPRDEFN
     0.002     0.002 #002 RC=   0 COM=SELECT LANGUAGE_CD FROM PSOPRDEFN
WHERE OPRID = :1
     0.007     0.000 #002 RC=   0 SSB=0001 TYPE=SQLPBUF LEN=0003
     0.000     0.000 #002 RC=   0 Bind=0001 Type=SQLPBUF Len=0002 Data=PS
     0.000     0.000 #002 RC=   0 Execute
     0.000     0.000 #002 RC=   0 Fetch
     0.000     0.000 #001 RC=   0 Close Cursor for PTPRUNID_S_GETID
     0.000     0.000      RC=   0 GETSTMT Stmt=PTPLOGMS_I_LOGMSG
     0.002     0.002 #001 RC=   0 Prepare=INSERT INTO PS_MESSAGE_LOG
( PROCESS_INSTANCE, MESSAGE_SEQ, JOBID,
 PROGRAM_NAME, MESSAGE_SET_NBR, MESSAGE_NBR, MESSAGE_SEVERITY, DTTM_STAMP_SEC )
 VALUES (:1,:2,:3,:4,:5,:6,:7,:8)
     0.006     0.000 #001 RC=   0 Bind=0001 Type=SQLPSLO Len=0004 Data=000000044
     0.000     0.000 #001 RC=   0 Bind=0002 Type=SQLPSLO Len=0004 Data=000000001
     0.000     0.000 #001 RC=   0 Bind=0003 Type=SQLPBUF Len=0008 Data=PTPTEDIT
     0.000     0.000 #001 RC=   0 Bind=0004 Type=SQLPBUF Len=0008 Data=PTPTEDIT
     0.000     0.000 #001 RC=   0 Bind=0005 Type=SQLPSLO Len=0004 Data=000000104
     0.000     0.000 #001 RC=   0 Bind=0006 Type=SQLPSLO Len=0004 Data=000000101
     0.000     0.000 #001 RC=   0 Bind=0007 Type=SQLPSLO Len=0004 Data=000000010
     0.000     0.000 #001 RC=   0 Bind=0008 Type=0392 Len=0026
Data=1999-10-12-17.40.35.580000
     0.000     0.000 #001 RC=   0 Execute
     0.000     0.000 #001 RC=   0 Row Count=000000001
     0.000     0.000      RC=   0 GETSTMT Stmt=PTPLOGMS_S_GETMSG
     0.002     0.002 #003 RC=   0 COM=SELECT MESSAGE_TEXT FROM PS_MESSAGE_CATALOG
 WHERE LANGUAGE_CD = :1 AND
 MESSAGE_SET_NBR = :2 AND MESSAGE_NBR = :3
     0.006     0.000 #003 RC=   0 SSB=0001 TYPE=SQLPBUF LEN=0100
     0.000     0.000 #003 RC=   0 Bind=0001 Type=SQLPBUF Len=0003 Data=ENG
     0.000     0.000 #003 RC=   0 Bind=0002 Type=SQLPSLO Len=0004 Data=000000104
     0.000     0.000 #003 RC=   0 Bind=0003 Type=SQLPSLO Len=0004 Data=000000101
     0.000     0.000 #003 RC=   0 Execute
     0.000     0.000 #003 RC=   0 Fetch
 > 1999-10-12-17.40.35.580000 INFO(104,101) PI(44) Program(PTPTEDIT)
 TSE Application Edits:  Begin Job.
     0.006     0.000 #003 RC=   0 Commit
     0.013     0.000 #003 RC=   0 Commit
     0.001     0.001      RC=   0 GETSTMT Stmt=PTPUSTAT_U_PRCRQSB
     0.004     0.003 #001 RC=   0 Prepare=UPDATE PSPRCSRQST SET RUNSTATUS = :1
 ,MSGNUM = :2 ,MSGSET = :3 ,PRCSRTNCD = :4
 ,BEGINDTTM = CURRENT TIMESTAMP ,LASTUPDDTTM = CURRENT TIMESTAMP ,MSGPARM1 = :5
 ,MSGPARM2 = :6 ,MSGPARM3 = :7 ,MSGPARM4
 = :8 ,MSGPARM5 = :9 ,CONTINUEJOB = :10 WHERE PRCSINSTANCE = :11
     0.008     0.000 #001 RC=   0 Bind=0001 Type=SQLPBUF Len=0001 Data=7
     0.000     0.000 #001 RC=   0 Bind=0002 Type=SQLPSLO Len=0004 Data=000000000
     0.000     0.000 #001 RC=   0 Bind=0003 Type=SQLPSLO Len=0004 Data=000000104
     0.000     0.000 #001 RC=   0 Bind=0004 Type=SQLPSSH Len=0002 Data=0000
     0.000     0.000 #001 RC=   0 Bind=0005 Type=SQLPBUF Len=0001 Data=
     0.000     0.000 #001 RC=   0 Bind=0006 Type=SQLPBUF Len=0001 Data=
     0.000     0.000 #001 RC=   0 Bind=0007 Type=SQLPBUF Len=0001 Data=
     0.000     0.000 #001 RC=   0 Bind=0008 Type=SQLPBUF Len=0001 Data=
     0.000     0.000 #001 RC=   0 Bind=0009 Type=SQLPBUF Len=0001 Data=
     0.000     0.000 #001 RC=   0 Bind=0010 Type=SQLPSSH Len=0002 Data=0000
     0.000     0.000 #001 RC=   0 Bind=0011 Type=SQLPSLO Len=0004 Data=000000044
     0.000     0.000 #001 RC= 100 Execute
     0.000     0.000 #001 RC=   0 Row Count=000000000
Some PeopleSoft COBOL programs utilize the stored statement technique of fetching and executing dynamic SQL. Programs fetch SQL statements—commonly known as stored SQL statements—from PS_SQLSTMT_TBL, then processes them using dynamic SQL (Prepares and Executes). Other COBOL programs are designed to generate their own SQL text inside the program, rather than fetching the SQL text from a table. This technique is sometimes referred to as “dynamic-dynamic,” and is more commonly known as “dynamic statement” owing to its ability to generate dynamic SQL text and then to execute a dynamic SQL statement.
In the past, the timings of these dynamically generated statements have been recorded to the DYSQLLOG. In PeopleSoft 8 we have included the information on ‘dynamic-dynamic’ SQL statements into the PeopleSoft trace.
For example:
DYSQLLOG from previous versions of PeopleTools:

************************************************************************
DYNAMIC SQL-STATEMENT (Len=  90)
UPDATE PS_TSE_EDITTBL SET TSE_EDIT_ERROR = ' ' WHERE (SETID = 'USA' AND
COMPANY = 'CCB')
Begin Time      End Time           Stmt Run Time           Total Run Time
08:59:42        08:59:42           0.00.00.000000          0.00.00.000000
************************************************************************
Same dynamic SQL represented in the new PeopleTools trace for PeopleSoft appears as follows:
0.010     0.000 #001 RC=   0 DYNAMICSTMT Stmt=PTPEDIT_U_HE000
0.003     0.003 #001 RC=   0 Prepare=UPDATE PS_TSE_EDITTBL SET TSE_EDIT_ERROR = ''
WHERE (SETID = 'USA' AND  COMPANY = 'CCB')
0.007     0.000 #001 RC=   0 Execute
0.007     0.000 #001 RC=   0 Row Count=000000008
Note: The PeopleSoft SQL trace can grow very large, so do your initial testing on smaller processes—for example, a small number of journals to EDIT or POST.
For SQR programs, there is no report available that shows statement timings like the one provided by PTPSQLRT. However, you can generate a SQL script consisting of fully resolved DB2 UDB for z/OS statements by running the SQR with the -S option.
There are three areas that SQR monitoring can be introduced and four ways that it can be enabled.
Adding SQR Flag to SQRSAMP
The first area is in the JCL member SQRSAMP. The SQR flag can be added to the PARMLIB(SQRPARMS) directly if you plan to use sample JCL member JCLLIB(SQRSAMP).
DSN SYSTEM(DSND)
RUN PROG(SQR)  -
    PLAN(SQR84) -
    LIB('<PSHLQ>.SQR.UNICODE.LOAD') -
    PARMS('SP DSN/PT84 -FSQROUT -S -GPRINT=NO -ISI -TBZ -PRINTER:LP')
END
Configuring Process Scheduler
The second area is within the Process Scheduler configuration, as follows:
To include the –S flag when configuring the PSOS390 Process Scheduler:
Initialize the PSADMIN program on Unix System Services to administer the Process Scheduler PSOS390.
You may either select Option 3 - Configure a Process Scheduler Server, or Option 6 - Edit a Process Scheduler Configuration File.
If you select Option 3, you would set the value for PSSQRFLAGS to -GPRINT=NO -TBZ -S.
If you select Option 6, you need to locate the related section in the file and change the PSSQRFLAGS value to -GRPINT=NO -TBZ -S.
Amending the Process Definition
The third area is from within the Process Definition. If you are running the SQR via the PSOS390 server, you have to append the –S flag to the process definition.
This can be accomplished by selecting PeopleTools, Process Scheduler Manager, Use, Process Definitions. Enter ‘SQR Report’ or ‘SQR Process’ for the process type and enter the SQR name (for example, XRFWIN). Select the Override Options tab and then select Append from the drop down Parameter list and enter the –S. This appends the –S flag to the SQR list when you run the SQR. Output from the –S flag is directed to SYSOUT in the SHELSQR JCL, which is the output queue by default.
Sample output from SQR with the –S flag enabled:
Cursor Status:

Cursor #1:
   SQL = SET CURRENT PRECISION = 'DEC31'
Compiles = 1
Executes = 1
Rows     = 0

Cursor #2:
   SQL = select A.RECNAME, A.SQLTABLENAME  FROM PSRECDEFN A WHERE
         A.SQLTABLENAME <> ' ' AND A.SQLTABLENAME <> A.RECNAME ORDER BY
         RECNAME
Compiles = 1
Executes = 1
Rows     = 0

Cursor #3:
  SQL = select A.RECNAME, A.SQLTABLENAME  FROM  PSRECDEFN A WHERE A.RECTYPE
        AND A.RECNAME <> 'PSDUMMY' ORDER BY A.RECNAME
Compiles = 2
Executes = 1
Rows     = 1284

Cursor #4:
  SQL = select 'X' FROM SYSIBM.SYSTABLES B WHERE B.CREATOR = CURRENT SQLID
        AND B.NAME = ? AND B.TYPE = 'T'
Compiles = 2
Executes = 1284
Rows     = 1280
Note: The -S option produces output that shows the frequency in which all SQL statements are compiled and executed.