Using the Integration Network Transactional Tracker
This section discusses how to:
Select nodes to track in the Transactional Tracker.
Fetch and synchronize Transactional Tracker data.
Filter Transactional Tracker data.
View network asynchronous transaction instances.
View network asynchronous transaction detail information.
View network synchronous transaction detail information.
View network transaction information for specific transactions.
The Network Transactional Tracker, or Transactional Tracker, enables you to track inbound and outbound integrations between the local node and all other nodes defined in the integration network.
The Transactional Tracker component (IB_INTNET_TRACKER) features three page for tracking activity:
|
Field or Control |
Definition |
|---|---|
| Tracker Overview |
The Tracker Overview page (IB_INTNET_TRACKOVR) shows information about inbound and outbound asynchronous service operation instances, including the number of service operation instances, publication contracts, and subscription contracts that have been processed between the local node and a selected remote node. You can filter transaction information to display by queue or by service operation. For each transaction returned as a query result, the system provides a link to the Transactional Tracker Details page where you can review complete information for the transaction as well as cancel the transaction or resubmit the transaction for processing, depending on its processing status. |
| Tracker Main View |
The Tracker Main View page (IB_INTNET_TRACKER) shows detailed information for inbound and outbound asynchronous transactions, including transaction ID, publishing timestamp, and more. You can filter transaction information by transaction ID, service operation name, queue name, and/or the direction of the transactions. This page features a link to the Integration Broker Statistics pages, so you can view transaction performance statistics to identify performance issues in the integration system. For each transaction returned as a query result, the system provides a link to the Transactional Tracker Details page where you can review complete information for the transaction as well as cancel the transaction or resubmit the transaction for processing, depending on its processing status. |
| Synchronous Tracker View |
The Synchronous Tracker View page (IB_INTNET_TRACKSYN) enables you to view detailed information for inbound and outbound synchronous transactions between integration network nodes. You can filter transaction information by service operation name, the direction of the transaction, and/or by the status of processing status in the system. Like the Tracker Main View page, this page also features a link to the Integration Broker Statistics pages to view performance statistics and identify issues in the integration system. You can also launch the Integration Broker Service Operations Monitor – Synchronous Details page from this page to view error and logging information for specific transactions, depending on its processing status. |
The pages in the Transactional Tracker feature links to the following pages that enable you to view details for a single transaction:
|
Field or Control |
Definition |
|---|---|
| Transactional Tracker Details |
The Transactional Tracker Details page (IB_INTNET_TRACKDET) provides a snapshot view of all details for a single asynchronous transaction. The Tracker Main page and the Tracker Main View page provide links to the Transaction Tracker Details page. For the sending node and receiving node in the transaction, the system displays the transaction ID, the service operation name, queue name, processing status, and more. In addition, depending on the processing status you can cancel or resubmit the transaction for processing. |
| Synchronous Details |
The Synchronous Details page (IB_INTNET_TRSYNCDT) provides a snapshot view of the transaction from the perspective of the sending node or the receiving node. The page features controls that enable you to view transaction errors and resubmit or cancel a transaction if there is a processing error. |
Note the following prerequisites for using the transactional tracker:
You must set up Transaction Tracker monitor options using the Network Monitor Setup page. The options you set on the page apply to your monitoring activity in the Network Monitor and the Transactional Tracker.
Information about options is provided elsewhere in the documentation.
To track transactions with remote PeopleSoft nodes the remote nodes must be active and defined in the integration network.
The Tracker Main View page and the Synchronous Tracker View page provide access to the Integration Broker performance statistics pages. To successfully use the performance statistics pages you must enable the statistics feature.
The Synchronous Tracker View page provides links to the Synchronous Details page for viewing logging data. To capture logging data for a service operation you must set the log level on the routing definition for the service operation.
|
Field or Control |
Definition |
|---|---|
| Network Node List |
Displays the active integration network nodes for which you can track activity. |
| Re-Sync Monitor Data |
Click the button to refresh the fetched data. The system automatically refreshes the data when you initially access any of the pages in the Transactional Tracker and when you initially select a node in the Network Node List. |
| Last Sync |
The read-only field displays the date and time that the transaction data was refreshed. |
| Monitor Setup |
Click the link to access the Network Monitor Setup page to modify setup options, such as the number of rows to return for a query. |
| Search Details |
Click the link to retrieve a summary detail for a specific transaction. When you enter a transaction ID for an asynchronous transaction the Transactional Tracker Details page appears. When you enter a transaction ID for a synchronous transaction the Synchronous Details page appears. |
| Time Period |
Use the options in the Time Period group box to limit the query results to transactions that occurred during a specific date range or that occurred between a specific date and time range. The Time Period group box features four fields for searching by date and time: From Date, To Date, From Time and To Time. If you complete just the date fields, the time fields automatically populate from 12:01 a.m. to 11:59 p.m. When left blank, no date or time is used as part of the search criteria. |
| Filter |
Click the button to filter the fetched data using the filters selected. |
| Sender Node |
This read-only field displays the name of the sending node for the transaction query. |
| Receiver Node |
This read-only field displays the name of the receiving node for the transaction query. |
| View Statistics |
Click the link to view system performance statistics for asynchronous and synchronous transactions that flow through PeopleSoft Integration Broker. The statistics can help you to identify bottlenecks and other performance issues in your integration system. |
 |
Click the button to show sender and receiver details in one view, instead of on separate sender and receiver tab. Click the button again to collapse the view. |
| Sender |
Click the tab to view transaction overview information for the sending node. |
| Receiver |
Click the tab to view transaction overview information for the receiving node. |
Each page of the Transactional Tracker features a Network Node List. The Network Node List contains a list of active integration network nodes for which you can track transaction activity between the local node. The Network Node List appears on all of the Transactional Tracker pages.
Image: Network Node List
This example illustrates the Network Node List.
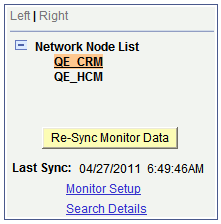
The example shows that there are two active network nodes, QE_CRM and QE_HCM. The QE_CRM node is highlighted and denotes that it is the currently selected node for tracking transactions between the local node.
To change or select a node, click the node name in the tree.
When you select a node in the Network Node List, the system automatically resynchronizes and fetches the most current transaction data for the selected node and the local node.
The PeopleSoft system fetches and synchronizes Transactional Tracker data when you initially access the Transactional Tracker component and when you change nodes in the Network Node List.
You can also manually synchronize data by clicking the Re-Sync Monitor Data button. The Re-Sync Monitor Data button appears on each page of the Transactional Tracker under the Network Node List.
The synchronization process synchronizes and updates the fetched data with changes in the database since the last synchronization.
A Last Sync field appears under the Re-Sync Monitor Data button and displays the date and time that the tracker data was last synchronized, whether it be by manual synchronization or system synchronization.
Controls on each page the Transactional Tracker provide data filters that enable you to narrow the fetched data results to that data which is most relevant to you.
After choosing the filters, you click the Filter button to obtain the filtered results.
For example, each page of the Transactional Tracker features a Time Period group box where you can filter the fetched data by date or by date and time.
The specific data filters for each page are described in the Common Elements Used in the Transactional Tracker section and in the documentation for the pages on which they appear.
Use the Tracker Overview page (IB_INTNET_TRACKOVR) to view instance information for asynchronous transactions between the local node and remote nodes in the integration network.
Before using the Tracker Overview it’s a good idea to review thePrerequisites for Using the Transactional Tracker.
The page enables you to view transaction instance counts for sending and receiving nodes at each queue level in the system. You can view this information by service operation or queue, and the direction of the transaction (inbound or outbound).
When you access the Transactional Tracker component, the Tracker Overview page appears by default.
To access the Tracker Overview page, select and in the WorkCenter navigation pane, click Transactional Tracker.
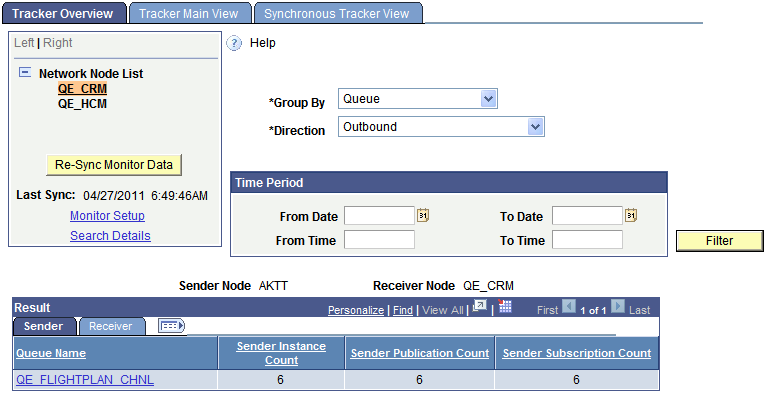
Image: Transactional Tracker – Tracker Overview page
This example illustrates the fields and controls on the Transactional Tracker – Tracker Overview page. You can find definitions for the fields and controls later on this page.
Use the Network Node List to select the remote node for which to track transactions. The system fetches available transaction data between the local node and the remote node. The system automatically synchronizes the data that appears on the page when you initially access the page and when you change the remote node.
Use one or more of the following data filters on this page:
|
Field or Control |
Definition |
|---|---|
| Group By |
Displays transactions based on the option selected. The valid options are:
|
| Direction |
Indicates the direction of the transaction. The valid values are:
|
| Time Period |
Use the options in the Time Period group box to limit the query results to transactions that occurred during a specific date range or that occurred between a specific date and time range. The Time Period group box features four fields for searching by date and time: From Date, To Date, From Time and To Time. If you complete just the date fields, the time fields automatically populate from 12:01 a.m. to 11:59 p.m. When left blank, no date or time is used as part of the search criteria. |
The Results grid displays the transaction instance data based on the default values for the filters. You can change the values for any of the fields and click the Filter button to display data based on the different filters.
When viewing the fetched data click the Expand icon to view the columns for all returned data.
Image: Transactional Tracker – Tracker Overview page
This example illustrates the Tracker Overview page with the Results grid expanded to show all data returned by the system.
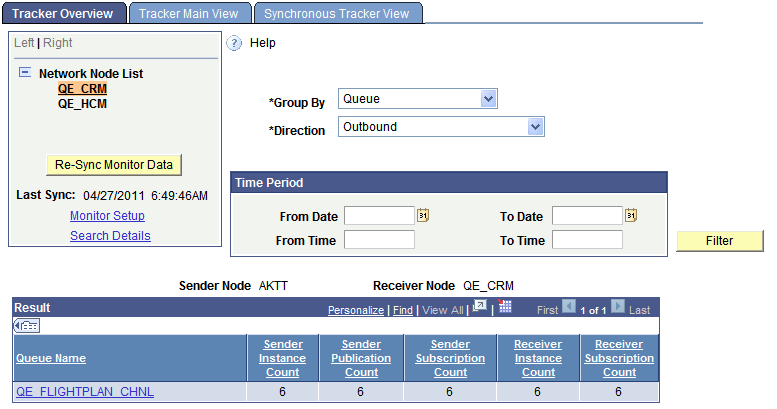
In the Results grid, click the Sender or Receiver tab to view counts of message instances, publication contracts, and subscription contracts processed by each respective node.
The following information appears in the Results grid on the Sender tab:
|
Field or Control |
Definition |
|---|---|
| Queue Name |
Appears when the Group By filter is set to Queue. The name of the queue that contains the name of the instances shown. Click a queue name link to launch the Tracker Main View page to view details of the transactions associated with the queue. |
| Service Operation |
Appears when the Group By filter is set to Service Operation. The name of the service operation that contains the instances shown. Click a service operation name link launch the Tracker Main View page to view details of the transactions associated with the service operation. |
| Sender Instance Count |
Shows the number of message instances the sender has sent to the receiving node. |
The following information appears in the Results grid on the Receiver tab:
|
Field or Control |
Definition |
|---|---|
| Sender Publication Count |
Shows the number of publication contracts the sender has sent to the receiving node. |
| Sender Subscription Count |
Shows the number of subscription contracts the sender has sent to the receiving node. |
| Receiver Instance Count |
Shows the number of message instances received by the receiving node. When viewing the Sender tab you may have to click the Expand icon on the Results grid to view this field. |
| Receiver Subscription Count |
Shows the number of subscription contracts received by the receiving node. |
This section describes how to use the Transactional Tracker to view asynchronous transaction details.
Understanding Integration Network Asynchronous Processing Status Information
Asynchronous transactional detail information that the Transactional Tracker provides includes processing status information for service operation instances, publication contracts, and subscription contracts.
The processing statuses that the Transactional Tracker uses for asynchronous service operations are the same as those used in the Service Operations Monitor.
Viewing Integration Network Asynchronous Transactional Details
Use the Tracker Main View page (IB_INTNET_TRACKER) to view details for asynchronous transactions between the local node and remote nodes in the integration network.
Before using the Tracker Main View page it’s a good idea to review the Prerequisites for Using the Transactional Tracker.
The Tracker Main View page enables you to view the transaction IDs, queue names, processing status, and more for the transactions.
You can access the Tracker Main View page from the Tracker Overview page using the Results grid; click the queue name or service operation link in the grid. You can also access the page using the standard PeopleSoft Pure Internet Architecture navigation by selecting In the WorkCenter navigation pane, click the Transactional Tracker link and then click the Tracker Main View tab.
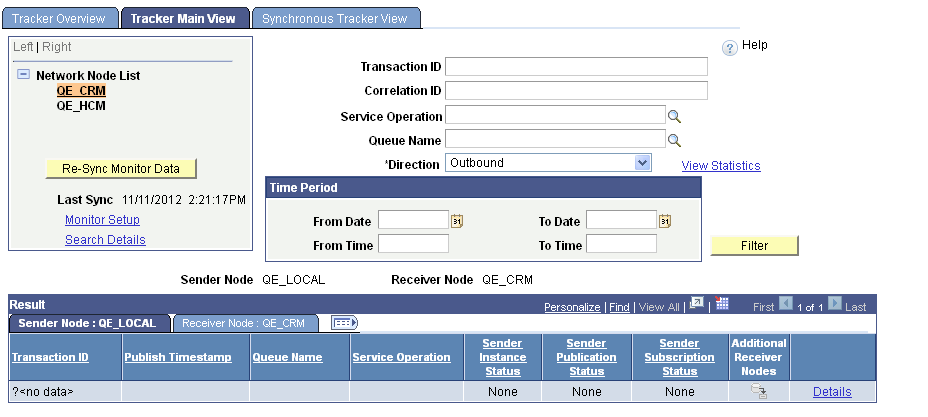
Image: Transactional Tracker – Tracker Main View page
This example illustrates the fields and controls on the Transactional Tracker – Tracker Main View page. You can find definitions for the fields and controls later on this page.
If you access the page from the Tracker Overview page, the page populates with data based on the query results from the Tracker Overview page. If you access the page without first conducting a query on the Tracker Overview page, click the Re-Sync Monitor Data button to populate the page with query data.
Use one of more of the following filters on this page:
|
Field or Control |
Definition |
|---|---|
| Transaction ID |
Enter the unique identifier for the transaction in the PeopleSoft system. |
| Correlation ID |
Enter the unique identifier that is used to correlate messages that are sent separately into a single transaction. |
| Service Operation |
Enter the name of a service operation to view transactions using the operation. |
| Queue Name |
Enter the name of a service operation queue that is processing transactions to view. |
| Direction |
Indicates the direction of the transaction. The valid values are:
|
| Time Period |
Use the options in the Time Period group box to limit the query results to transactions that occurred during a specific date range or that occurred between a specific date and time range. The Time Period group box features four fields for searching by date and time: From Date, To Date, From Time and To Time. If you complete just the date fields, the time fields automatically populate from 12:01 a.m. to 11:59 p.m. When left blank, no date or time is used as part of the search criteria. |
If you access the Tracker Main View page from the Tracker Overview page, the system defaults the queue name or service operation name from the Tracker Overview page as a filter. In addition, the direction of the transaction as viewed on the Tracker Overview page is also defaulted on the page.
The following information appears in the Results grid on the Sender Node tab:
|
Field or Control |
Definition |
|---|---|
| Transaction ID |
The unique identifier for the transaction in the PeopleSoft system. |
| Publish Timestamp |
Date and time the transaction was published. (Outbound transactions.) |
| Sender Instance Status |
Processing status of the instance on the sending system. |
| Sender Publishing Status |
Processing status of the publication contract on the sending system. |
| Sender Subscription Status |
Processing status of the subscription contract on the sending system. |
| Additional Receiver Nodes |
Click the link to view the names of other nodes in the network receiving the transaction. |
| Details |
Click the Details link for a summary view of the transaction using the Transaction Tracker Details page. In addition a snapshot view of sending and receiving node details, you can also cancel and resubmit transactions for processing from the page. |
After a query the following information appears in the Results grid on the Receiver Node tab:
|
Field or Control |
Definition |
|---|---|
| Receiver Instance Status |
Processing status of the service operation instance on the receiving system. |
| Receiver Subscription Status |
Processing status of the subscription contract on the receiving system. |
This section describes using the Synchronous Tracker View page to view integration network synchronous transactional details.
Understanding Integration Network Synchronous Processing Status Information
Synchronous transactional detail information that the Transactional Tracker provides includes processing status information for service operations.
The processing statuses that the Transactional Tracker uses for synchronous service operations are the same as those used in the Service Operations Monitor. The statuses for synchronous service operations are:
|
Field or Control |
Definition |
|---|---|
| Done |
Indicates the synchronous request was successful. |
| Error |
Indicates that an error occurred during processing. Manual intervention is required. |
Prerequisites for Viewing Integration Network Synchronous Transactional Details
Before using the Synchronous Tracker View page see thePrerequisites for Using the Transactional Trackerdescribed elsewhere.
As part of the query results for synchronous transaction queries the system provides a Details link. The Detail link provides access to the Synchronous Details page in the Service Operations Monitor where you can view logging information. To access and view the logs you must set the logging level on the routing definition of all service operations for which you want to view logging information.
Viewing Integration Network Synchronous Transactional Details
Use the Synchronous Tracker View page (IB_INTNET_TRACKSYN) to view details for synchronous transactions between the local node and remote nodes in the integration network. The page enables you to view the transaction IDs, timestamps, service operation name, service operation version, service operation type, and more for integration network synchronous transactions.
To access the page select Then in the WorkCenter navigation pane click the Transactional Tracker link, and click the Synchronous Tracker View page.
Image: Transactional Tracker – Synchronous Tracker View page
This example illustrates the fields and controls on the Transactional Tracker – Synchronous Tracker View page. You can find definitions for the fields and controls later on this page.
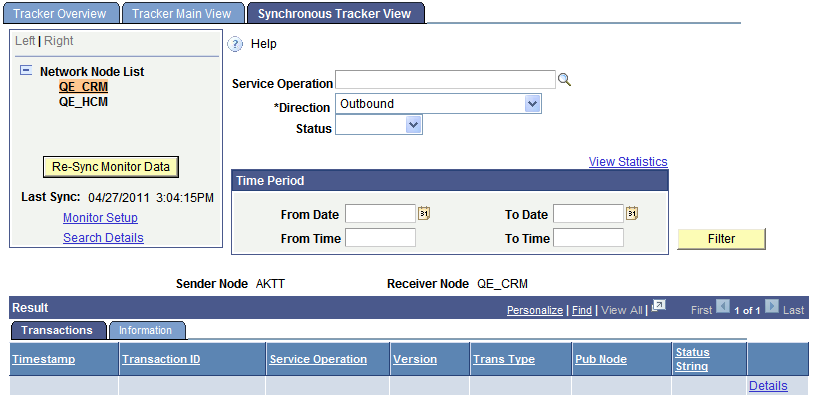
When you access the page, click the Re-Sync Monitor Data button fetch the data. The system displays the query results in the Results grid, based on the default filters.
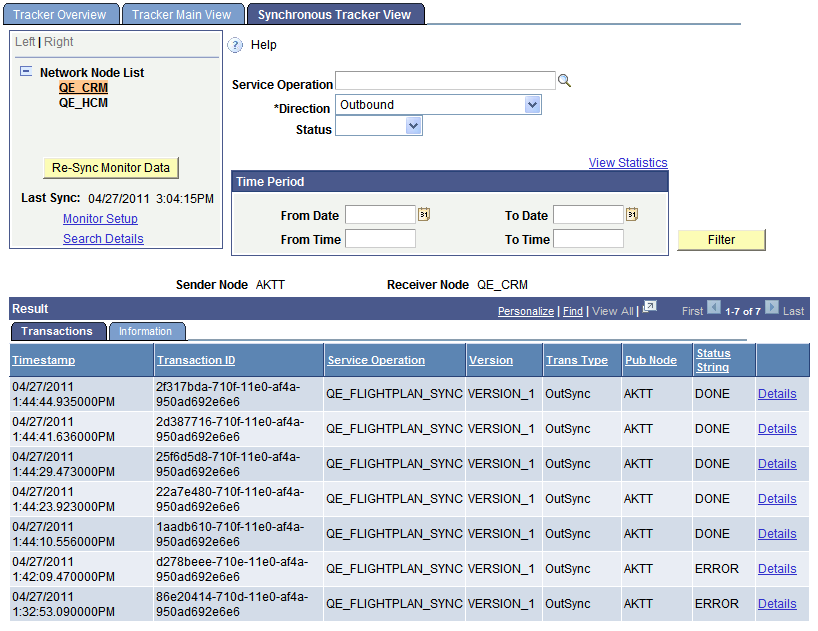
Image: Transactional Tracker – Synchronous Tracker View page
This example illustrates query results for the QE_CRM node based on the default Outbound direction filter and clicking the Re-Sync Monitor Data button
As with all the pages in the Transactional Tracker, the Synchronous Tracker View page features several filter options so that you can view the most relevant data for your business requirements. After you select filter options, click the Filter button to apply the filter(s). View the results in the Results grid. The valid data filters for the Synchronous Tracker View page are:
|
Field or Control |
Definition |
|---|---|
| Service Operation |
Use this option to filter transaction data by service operation. Enter the service operation name or click the Lookup button to search the database for a value. |
| Direction |
Indicates the direction of the transaction. The valid values are:
|
| Status |
Filter the fetched results by the processing status of the service operation. The valid values are:
|
| Time Period |
Use the options in the Time Period group box to limit the query results to transactions that occurred during a specific date range or that occurred between a specific date and time range. The Time Period group box features four fields for searching by date and time: From Date, To Date, From Time and To Time. If you complete just the date fields, the time fields automatically populate from 12:01 a.m. to 11:59 p.m. When left blank, no date or time is used as part of the search criteria. |
After a query the results appear on the Transactions and Information tabs in the Results grid.
The following information appears in the Results grid on the Transactions tab:
|
Field or Control |
Definition |
|---|---|
| Timestamp |
The date and time the service operation was sent to the receiving node. |
| Transaction ID |
The unique identifier for the transaction in the PeopleSoft system. |
| Service Operation |
The name of the service operation. |
| Version |
The service operation version. |
| Trans Type |
The service operation type. The valid values are:
|
| Pub Node |
The name of the node sending the transaction. |
| String Status |
The processing status of the service operation. The valid values are:
|
| Details |
Click the Details link to access the transaction in the Service Operations Monitor – Synchronous Details and view logging and error information. To capture logging information for a service operation you must set the logging level on the routing definition of the service operation. The Routings - Routing Definitions page features a Log Details drop-down list for setting the log level. |
The following information appears in the Results grid on the Information tab:
|
Field or Control |
Definition |
|---|---|
| Publisher |
Publisher of the service operation. This is usually the user ID of the person in the publishing system who triggered the publication. |
| Last Upd DtTm |
Indicates the date and time the transaction was last updated. |
| NRID |
Nonrepudiation ID. Identifies a unique number used to associate a service operation instance with the nonrepudiation log. |
| Dest Pub Node |
Destination publish node. Identifies the name of the node where the service operation was sent. |
| Final Dest Node |
Final destination node. Identifies the name of the node of the final destination for the service operation. |
| Details |
Click the Details link to access the transaction in the Service Operations Monitor – Synchronous Details and view logging and error information. To capture logging information for a service operation you must set the logging level on the routing definition of the service operation. The Routings - Routing Definitions page features a Log Details drop-down list for setting the log level. |
This section discusses how to:
Search for transaction data.
Access transaction data from query results grids.
View data for an asynchronous transaction.
View data for a synchronous transaction.
Understanding Viewing Integration Network Transaction Information for Specific Transactions
The Transactional Tracker features pages for viewing the details of specific transactions. Use the Transactional Tracker Details page to view information for an asynchronous transaction; use the Synchronous Details page to view information for a synchronous transaction.
Before using the Transactional Tracker Details page review thePrerequisites for Using the Transactional Tracker.
Searching for Transaction Data
You can search for and access the Transactional Tracker Details page or the Synchronous Details page using the Search Details link that appears on the Tracker Overview page, the Tracker Main View page, and the Synchronous Main View page.
Access the pages as follows:
Tracker Overview page: PeopleTools, Integration Broker, Integration Network WorkCenter, Transactional Tracker. The Tracker Overview page appears.
Tracker Main View page: Click the Tracker Main View tab.
Synchronous Main View page: Click the Synchronous Main View tab.
On each these pages the Search Details link appears under the Network Node List.
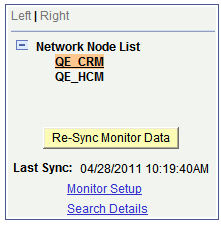
Image: Search Details link
This example illustrates the Search Details link under the Network Node list
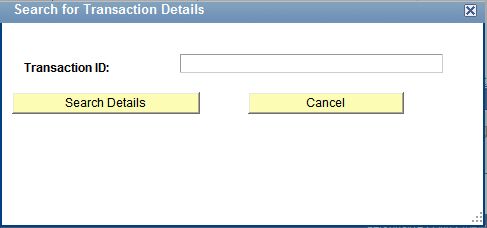
When you click the Search Details link the Search for Transaction Details page (IB_VERIFYNET_SEC) appears where you enter the transaction ID of the transaction you want to view.
Important! The transaction ID that you enter should always be the instance transaction ID.
Image: Search for Transaction Details page
This example illustrates the Search for Transaction Details page.
When you click the Search Details button to search for the transaction the Multiple Target Nodes page (IB_NODELIST_SEC) appears if the transaction exists on more than one network node:
Image: Multiple Target Nodes page
This example illustrates the Multiple Target Nodes page. In this example, a transaction exists on the nodes listed in the Node List grid, the QE_CRM and QE_HCM nodes.
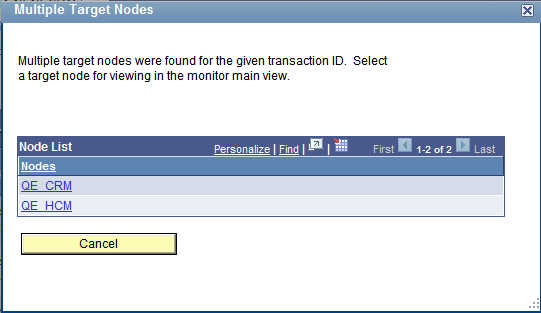
If the transaction exists on more than one network node, click the name of the node for which you want to view the transaction.
If you selected an asynchronous transaction, the Transactional Tracker Detail page appears in a separate browser window for the transaction on the selected node. If you selected a synchronous transaction, the Synchronous Details page appears in a separate browser window for the transaction on the selected node.
Note: If the Transactional Tracker Detail page or the Synchronous Details page do not appear in a full-size browser window, click the browser Restore button in the upper right-corner of the browser to restore the browser window to full size.
Accessing Transaction Data from Query Results Grids
When you conduct a query on the Tracker Main View page or the Synchronous Main View page the results appear in the Results grid at the bottom of the page. At the end of each row of results is a Details link that provides access to the transaction details for the specific transaction.
Access the pages as follows:
Tracker Main View page: Click the Tracker Main View tab.
Synchronous Main View page: Click the Synchronous Main View tab.
After you select a remote node and synchronize the data the query results appear in the Results grid at the bottom of the page.
Image: Results grid
This example illustrates a partial view of the Results grid for an asynchronous query on the Tracker Main View page.
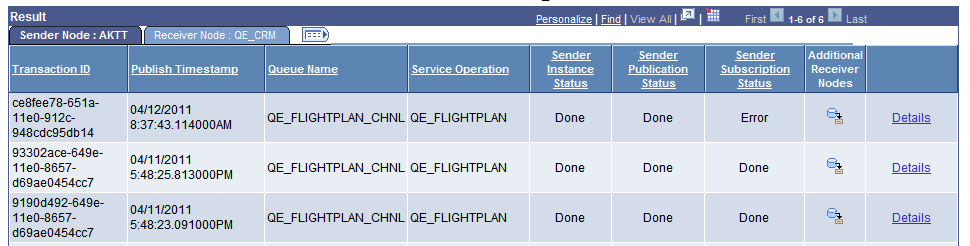
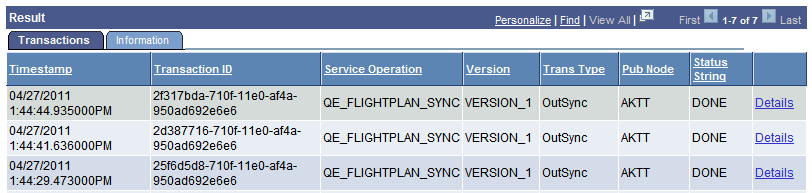
Image: Results grid
This example illustrates a partial view of the Results grid for a synchronous query on the Tracker Main View page.
Click the Details link for a transaction to launch the Transactional Tracker Details page for an asynchronous transaction or to launch the Synchronous Details page for a synchronous transaction. Note that either page appears in a separate browser window.
Note: If the Transactional Tracker Detail page or the Synchronous Details page does not appear in a full-size browser window, click the browser Restore button in the upper right-corner of the browser to restore the browser window to full size.
Viewing Data for an Asynchronous Transaction
The Transactional Tracker Details page features transaction information for the sending and receiving node.
To access the page click the Details link for a transaction in the Results grid on the Tracker Main View page.
Image: Transactional Tracker Details page
This example illustrates the Transactional Tracker Details page.
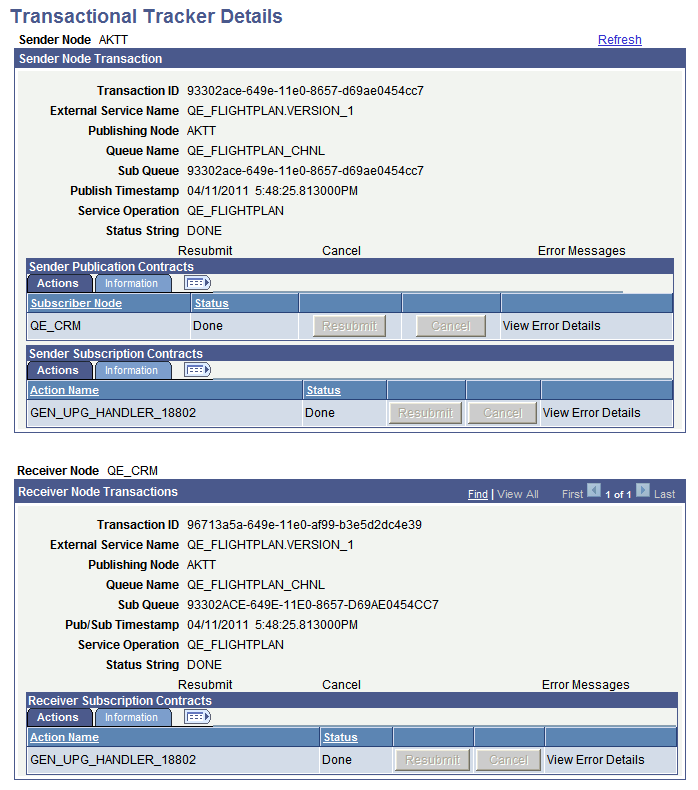
If errors exist in the transaction the Error Messages and View Error Details links are active and you can click them for additional details. The Resubmit and Cancel buttons on the page are enabled if the status of the transaction is such that these actions are warranted.
You can search for a specific transaction to view or you can launch the Transactional Tracker Details page from the results grid on the Tracker Main page or the Tracker Main View page.
Viewing Data for a Synchronous Transaction
The Synchronous Details page in the Transactional Tracker has the same format and content of the Synchronous Details page in the Integration Broker Service Operations Monitor, except that you cannot view transactional XML using the page in the Transactional Tracker.
Image: Synchronous Details page
This example illustrates the Synchronous Details page.
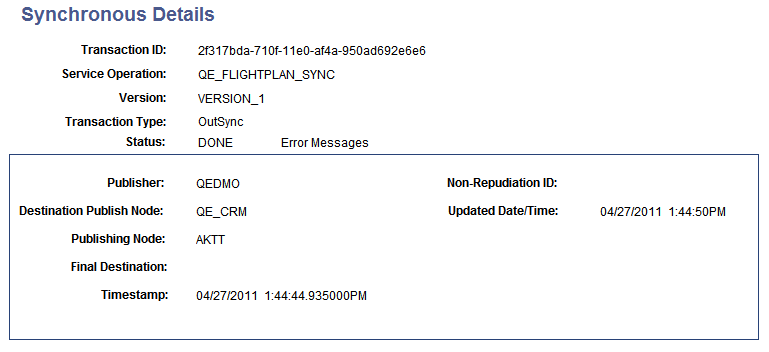
If errors exist in the transaction the Error Messages link is active and you can click the link for additional details. The Resubmit and Cancel buttons on the page are enabled if the status of the transaction is such that these actions are warranted.
The fields that appear on the page are described elsewhere in this section.