Viewing Messaging System Performance Statistics
This section discusses how to:
View inbound asynchronous messaging system statistics.
View outbound asynchronous messaging system statistics.
View inbound synchronous messaging system statistics.
View outbound asynchronous messaging system statistics.
|
Field or Control |
Definition |
|---|---|
| Action Name |
The name of the service operation handler. |
| Connection Time Total Avg.(Connection Time Total Average) |
When viewing outbound synchronous transactions, the value displayed on the link label indicates the average processing time between local and remote servers. This time includes the processing time of sending the request to the integration partner, as well as receiving the response. When viewing outbound asynchronous transactions, the value displayed on the link label indicates the average processing time between integration gateway and the remote system. Click the link to view separate statistics for application server and remote server processing. |
| Integration Service Total |
Complete processing time for the specific transaction. |
| Orig Transaction ID(Original Transaction ID) |
Original transaction IDs are associated with asynchronous transactions only. The system creates an original transaction ID when it creates the message instance. Note: An original transaction ID is different than a transaction ID. An original transaction ID is associated with a message instance, and a transaction ID is associated with a publication or subscription contract |
| Purge All Statistic Files,Purge All Synchronous Timings,Purge All Subscription Timings,Purge All Publication Timings |
Click one of these buttons to purge performance statistics for the given transaction type. Warning! The Purge All Statistics Files button will permanently delete data on all the Statistics page. The other buttons permanently delete statistics on the page on which they appear. Use these options when you are done using the statistics or want to view new performance statistics. These options are discussed in additional detail elsewhere in this topic. |
| Segment |
When a service operation contains segmented message, this field indicates the number of the message segment. If a service operation does not contain a segmented message, the field displays a value of 1. The default value of this field is 1. |
| Sync Total(Synchronous Total) |
Displays when working with outbound synchronous transactions. Indicates the total processing time for a single synchronous transaction. |
| Transaction ID |
The unique identifier for the transaction assigned by the system. |
| TCA(Target Connector Adapter) |
Displays when viewing outbound synchronous transactions This field indicates the processing time of the adapter to connect to an integration partner and receive a response for a single transaction. |
| Timestamp |
Displays the date and time that the service operation flowed through the system. |
| Transaction Local Avg.(Transaction Local Average) |
This link displays when working with inbound synchronous statistics. The value displayed on the link label indicates the average processing time for all selected transactions on the local system. Click the link to view more detailed information for application server processing times. |
| Transaction Total Avg.(Transaction Total Average) |
Displays when working with synchronous statistics. The value displayed on the link label indicates the average processing time (request and response) for all selected transactions. Click the link to view statistics for application server, integration gateway, and remote server processing. |
Initial search results for inbound asynchronous messaging system performance statistics display in the Subscription Timing Data grid. The data in grid provides high-level information about the transactions. The fields that appear in this grid are described elsewhere in this section.
See Common Elements Used to View Messaging System Performance Statistics.
Click the Averages and Analysis link to show performance statistics for integration gateway, application server, broker handler, and subscription contract processing times. The Averages and Analysis page for inbound asynchronous transactions is shown earlier in this topic.
See Using the Statistics Pages.
The Averages and Analysis page shows the flow of transactions in graphical format. The flow of the transaction(s) is from left to right. The integration gateway receives the requests and sends the Jolt requests to the application server. The application server performs any service authentication and passes the requests to the subscription broker. The broker evaluates the transactions and creates the subscription contracts.
The following table lists the links that display on the Averages and Analysis page when viewing inbound asynchronous transactions. It also lists the names of the pages that open when you click a link and describes the data that may display. The actual data that displays depends on the makeup of the transactions.
|
Field or Control |
Definition |
|---|---|
| Gateway |
The value that displays on the link label is the average processing time for the selected transactions on the integration gateway. Click the link to open the Gateway Averages page. Use the page to view the statistics that comprise the integration gateway processing average. They can include:
|
| Application Server |
The value that displays on the link label is the average processing time for the selected transactions on the application server. Click the link to open the Server Averages page. Use this page to view the statistics that comprise the application server processing average. They can include:
|
| Broker |
The value that displays on the link label is the average publication broker processing time for the selected transactions. Click the link to open the Broker Averages page. Use this page to view the statistics that comprise the publication broker processing average. They can include:
|
| (Broker) Tuxedo Queue Size |
The value that displays on the link label is average Oracle Tuxedo queue size at the time the broker processed the request. Click this link to open the Tuxedo Queue Size page. Use this page to view the average queue size during the processing of each service operation. The average queue size is the average number of processes or items in the queue waiting for processing at the time the service operation was processed. |
| Subscription |
The value that displays on the link label is the average subscription handler processing time for the selected transaction. Click the link to open the Subscription Contract Averages page. Use this page to view the statistics that comprise the average subscription handler processing time. They can include:
|
| (Subscription) Tuxedo Queue Size |
The value that displays on the link label is the average Oracle Tuxedo queue size at the time the subscription handler processed the request. Click the link to open the Tuxedo Queue Size page. Use this page to view the average queue size during the processing of each service operation. The average queue size is the average number of processes or items in the queue waiting for processing at the time the service operation was processed. |
Use the Outbound Asynchronous page to search for statistics for outbound asynchronous integrations.
Image: Outbound Asynchronous page
This example illustrates the Outbound Asynchronous page.
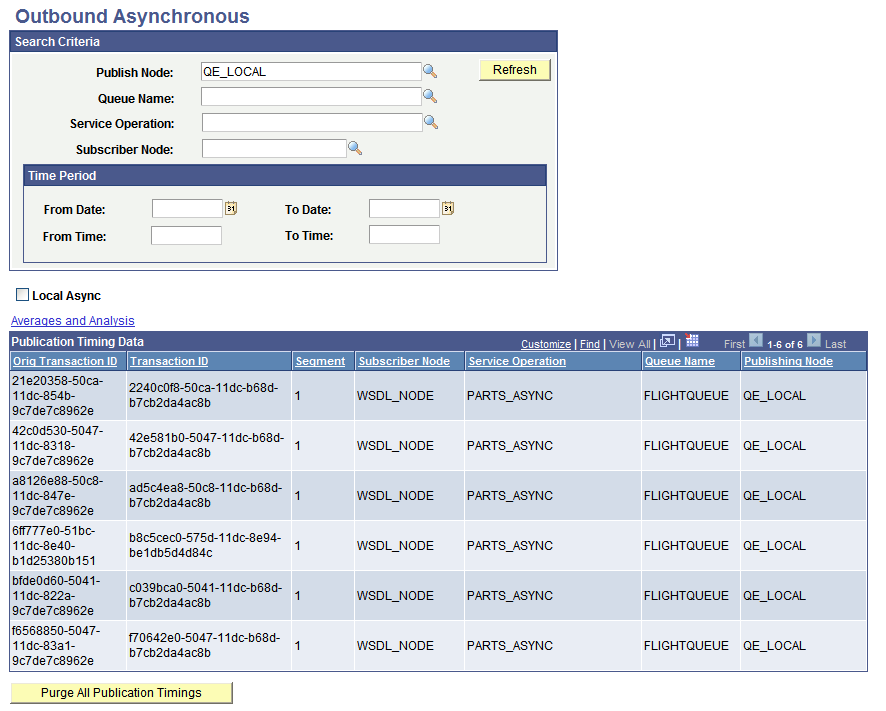
Initial search results for outbound asynchronous messaging system performance statistics display in the Publication Timing Data grid under the Search Criteria dialog box.
The data in grid provides high-level information about the transactions. The fields that appear in this grid are described elsewhere in this section.
See Common Elements Used to View Messaging System Performance Statistics.
Click the Averages and Analysis link to show performance statistics for subscription broker and publication handler processing times.
Image: Averages and Analysis page
This example illustrates the fields and controls on the Averages and Analysis page. You can find definitions for the fields and controls later on this page.
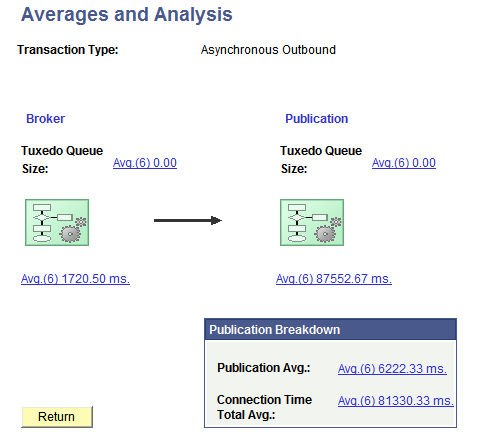
The Averages and Analysis page shows the flow of transactions in graphical format. The flow of the transaction(s) is from left to right: the broker evaluates the transactions and creates the publication contracts, and the publication handler processes the contracts.
The Publication Breakdown box shows the average time for creating the publication contracts as well as average time for connecting to perform the posts to the integration gateway.
The following table lists the links that display on the Averages and Analysis page when viewing statistics for outbound asynchronous transactions. It also lists the names of the pages that open when you click a link and describes the data that may display. The actual data that displays depends on the makeup of the transactions.
|
Field or Control |
Definition |
|---|---|
| Broker |
The value that displays on the link is the average broker processing time for the selected transactions. Click the link to open the Broker Averages page. Use this page to view the statistics that comprise the broker processing average. They can include:
|
| (Broker) Tuxedo Queue Size |
The value that displays on the link label is average Oracle Tuxedo queue size at the time the broker processed the request. Click this link to open the Tuxedo Queue Size page. Use this page to view the average queue size during the processing of each service operation. The average queue size is the average number of processes or items in the queue waiting for processing at the time the service operation was processed. |
| Publication |
The value that displays on the link is the overall average processing time for publication contracts. Click the link to open the Publication Contract Averages. Use this page to view the statistics that comprise the overall publication contract processing average. They can include:
|
| (Publication) Tuxedo Queue Size |
The value that displays on the link label is the average Oracle Tuxedo queue size at the time the publication handler processed the request. Click this link to open the Tuxedo Queue Size page. Use this page to view the average queue size during the processing of each service operation. The average queue size is the average number of processes or items in the queue waiting for processing at the time the service operation was processed. |
| Publication Average |
The value that displays on the link label is the average total publication time for the selected transactions. Click the link to open the Publication Contract Averages page. Use the page to view the publication statistics that are included in the publication average. They can include:
|
| Connection Time Total Avg (Connection Time Total Average) |
The value that displays on the link label is the average connection processing time between the integration gateway and the remote system for the selected contracts. Click the link to open the Averages and Analysis page. Use the page to view connection processing statistics that comprise the connection time average. They can include:
|
Results for searching for inbound synchronous statistics appear in under the Search Criteria section of the Inbound Synchronous page.
Image: Inbound Synchronous page
This example shows sample search results for inbound synchronous statistics.
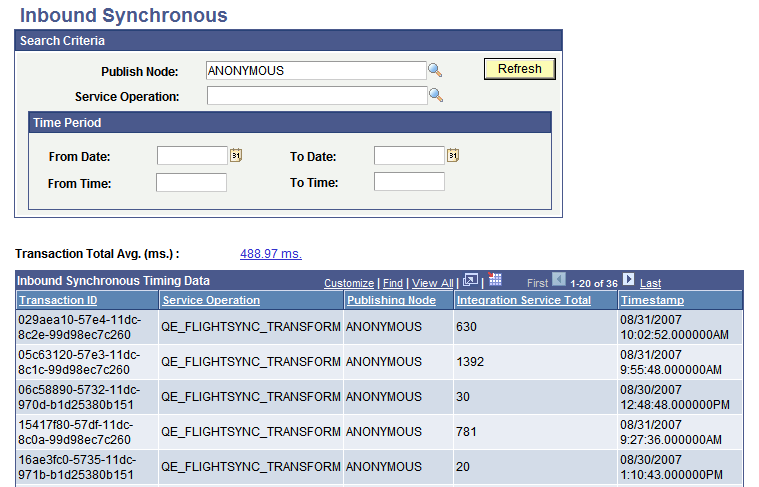
The Inbound Synchronous Timing Data grid in the previous graphic shows partial results of all results returned.
Initial search results for inbound synchronous messaging system performance statistics display in the Inbound Synchronous Timing Data grid under the Search Criteria dialog box.
The data in grid provides high-level information about the transactions. The fields that appear in this grid are described elsewhere in this section.
See Common Elements Used to View Messaging System Performance Statistics.
The value that displays in the Transaction Total Avg field is the average total transaction processing time for the selected transactions. Click the link open the Averages and Analysis page to view the statistics that comprise the total transaction processing time average.
Image: Averages and Analysis page
The following example shows the Averages and Analysis page for inbound synchronous transaction statistics
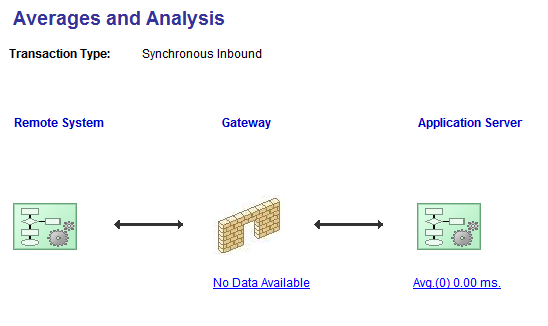
The Averages and Analysis page shows the flow of transactions in graphical format.
The flow of the transactions is from left to right. Remote servers send requests using HTTP to the integration gateway. The integration gateway sends the requests to the application server using Jolt requests.
The following table lists the links that display on the Averages and Analysis page when viewing statistics for inbound synchronous transactions. It also lists the names of the pages that open when you click a link and describes the data that may display. The actual data that displays depends on the makeup of the transactions.
|
Field or Control |
Definition |
|---|---|
| Remote System |
The value that displays on the link label is the average processing time on the remote server to send the request. The link appears only when the sending remote server is a PeopleSoft system. PeopleSoft systems send application server performance statistics with request messages. Click the link to open the Remote System Averages page. Use the page to view the statistics that comprise the average remote server processing time. The statistics displayed on this page can include:
|
| Gateway |
The value that displays on the link label is the average processing time for the selected transactions on the integration gateway. Click the link to open the Gateway Averages page. Use the page to view the statistics that comprise the integration gateway processing average. They can include:
|
| Application Server |
The value that displays on the link label is the average processing time on the application server. Click the link to open the Local Server Averages page. Use this page to view the statistics that comprise the application server process average. They can include:
|
Results for searching for outbound synchronous statistics appear in under the Search Criteria section of the Outbound Synchronous page.
Image: Outbound Synchronous page
The following example shows sample search results for outbound synchronous statistics.
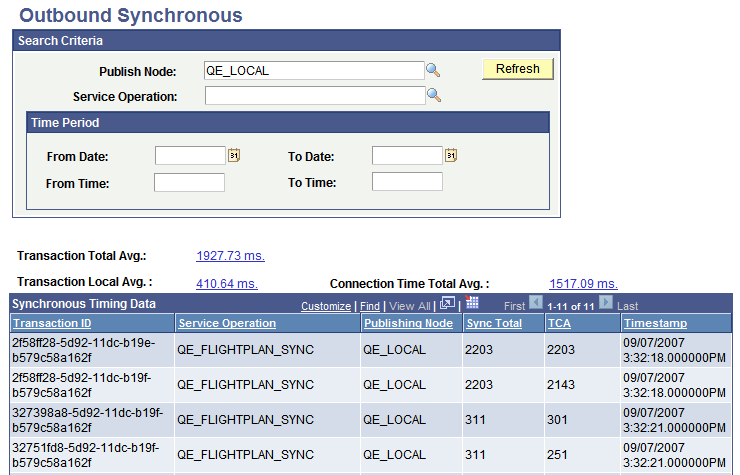
Initial search results for outbound synchronous messaging system performance statistics display in the Synchronous Timing Data grid under the Search Criteria dialog box.
The data in grid provides high-level information about the transactions. The fields that appear in this grid are described elsewhere in this section.
See Common Elements Used to View Messaging System Performance Statistics.
In addition, three links appear on the page:
|
Field or Control |
Definition |
|---|---|
| Transaction Total Avg.(Transaction Total Average) |
The value that appears on the link label is the average total transaction processing time for the selected transactions. The total includes processing on local and remote servers, as well as the total connection time to remote servers. Click the link to open the Averages and Analysis page. Use this page to view the application server, gateway and remote server statistics that comprise the total transaction processing time average. |
| Transaction Local Avg.(Transaction Local Average) |
The value that appears on the link label is the average total processing time on the local server for the selected transactions. Click the link to open the Averages and Analysis page. Use this page to view the application server statistics that comprise the total average local transaction processing time average. |
| Connection Time Total Avg.(Connection Time Total Average) |
The value that appears on the link label is the average total connection time between remote servers and local servers for the selected transactions. Click the link to open the Averages and Analysis page. Use this page to view the integration gateway and remote server statistics that comprise the connection time total average. |
Viewing Average Transaction Processing Time Statistics — Local and Remote Servers
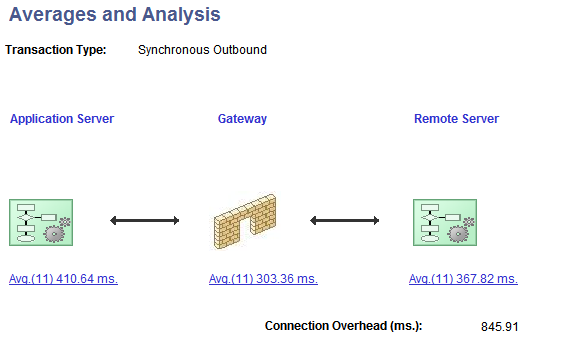
From the outbound synchronous search results page, click the Transaction Total Avg. link.
Image: Averages and Analysis page
This example illustrates the fields and controls on the Averages and Analysis page. You can find definitions for the fields and controls later on this page.
|
Field or Control |
Definition |
|---|---|
| Application Server |
The value that appears on the Application Server link label is the average processing time on the application server for the selected transactions. Click the link to open the Local Server Averages page. Use the Local Server Averages page to view the statistics that comprise the application server processing average. They can include:
|
| Gateway |
The value that appears on the Gateway link label is the average processing time on the integration gateway for the selected transactions. Click the link to open the Gateway Averages page. Use the Gateway Averages page to view the statistics that comprise the gateway processing average. They can include:
|
| Remote Server |
The value that appears on the Remote Server link label is the average processing time of the transactions on the remote system. The link appears only when the remote server is a PeopleSoft system. PeopleSoft systems send application server performance statistics with response messages. Click the link to open the Remote System Averages page. Use the Remote System Averages page to view the statistics that comprise the average remote server processing time. The statistics displayed on this page can include:
|
Viewing Average Transaction Processing Time Statistics — Local Server Only
From the outbound synchronous search results page, click the Transaction Local Avg. link.
Image: Averages and Analysis page
This example illustrates the fields and controls on the Averages and Analysis page. You can find definitions for the fields and controls later on this page.
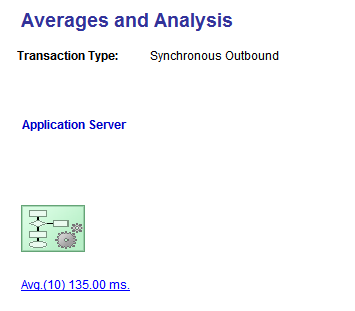
This example shows the average transaction processing time for outbound synchronous transactions.
|
Field or Control |
Definition |
|---|---|
| Application Server |
The value that appears on the application server link label is the average processing time on the application server for the selected transactions. Click the link to open the Local Server Averages page. Use this page to view the statistics that comprise the application server processing average. They can include:
|
Viewing Average Transaction Connection Time Statistics
From the outbound synchronous search results page, click the Connection Time Total Avg. link.
Image: Averages and Analysis page
This example illustrates the fields and controls on the Averages and Analysis page. You can find definitions for the fields and controls later on this page.
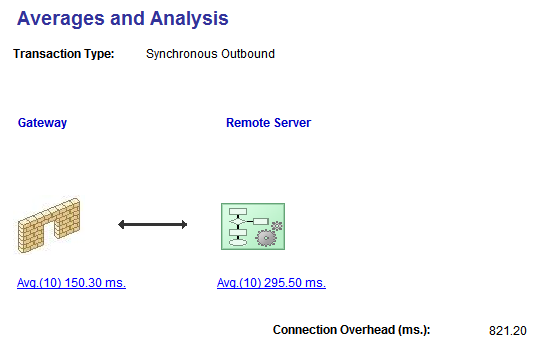
This example shows the average transaction connection time for synchronous outbound transactions.
The following table lists the links that display on the page. It also lists the names of the pages that open when you click a link and describes the data that may display. The actual data that displays depends on the makeup of the transactions.
|
Field or Control |
Definition |
|---|---|
| Gateway |
The value that appears on the link label is the average processing time on the integration gateway for the selected transactions. Click the link to open the Gateway Averages page. Use the page to view the statistics that comprise the average integration gateway processing time. They can include:
|
| Remote Server |
The value that appears on the link label is the average processing time on the remote server for the selected transactions. The link appears only when the remote server is a PeopleSoft system. PeopleSoft systems send back application server performance statistics with response messages. Click the link to open the Remote System Averages page. Use the page to view the statistics that comprise the average remote server processing time. Data appears on this page for transactions where the remote server is a PeopleSoft system. The statistics displayed on this page can include:
|
| Connection Overhead |
The value that appears on the link label includes miscellaneous connection processing times while sending the request from the integration gateway on the local system to the remote system, as well as connection time when the remote system returns a response to the local system. |