Using PeopleCode Debugger Features
This section discusses:
Visible current line of execution.
Visible breakpoints.
Hover inspect.
Single debugger.
Variable panes.
General debugging tips.
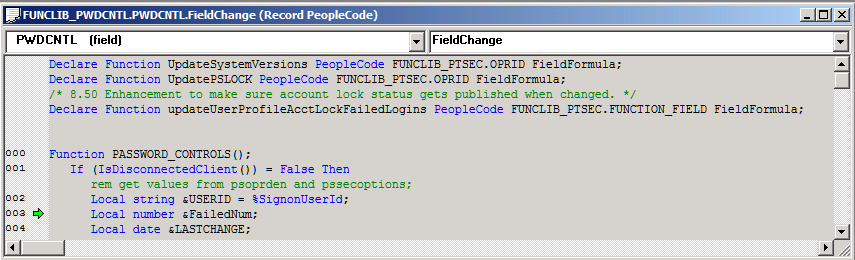
This example shows the current line indicator (green arrow displayed in left-hand gutter):
Image: PeopleCode debugger with current line of execution
This example illustrates the fields and controls on the PeopleCode debugger with current line of execution. You can find definitions for the fields and controls later on this page.
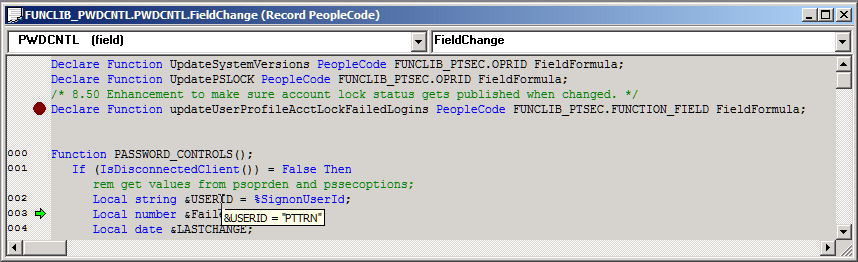
The PeopleCode debugger supports visual indicators that signify breakpoint locations. In the following example, the current line indicator (green arrow) is shown at the first line, and the breakpoint (red dot displayed in left-hand gutter) is on line 8:
All breakpoints are saved when Exit Debug Mode is selected.
Note: You cannot set breakpoints in function declarations, variable declarations, or comments.
If the program is already running, you can see the actual values for the variables by holding the cursor over them. The current value appears in a pop-up window, as shown in the following example:
Image: PeopleCode debugger with breakpoint, current line of execution, and hover inspect
This example illustrates the fields and controls on the PeopleCode debugger with breakpoint, current line of execution, and hover inspect. You can find definitions for the fields and controls later on this page.
Hover inspect is implemented only for simple variables and fields.
Hover inspect is not implemented for object expressions (for example, rowset assignments and array assignments).
Each PeopleSoft session you run on a machine can have its own debugging session. However, only one instance of the PeopleCode debugger can occur per session. If more than one instance of Application Designer is running for a session, only one may be the active debugger at a given time.
From within a running instance of Application Designer, any component in the same session is also placed into debug mode.
After the session is in debug mode, any component that is started and that belongs to that session automatically goes into debug mode.
Similarly, Application Engine PeopleCode and component interface PeopleCode can be debugged.
After you exit debug mode by selecting Debug, Exit Debug Mode or by exiting Application Designer, all components in that session go out of debug mode. If you exit a component, debugging continues with any remaining open and running components.
If more than one Application Designer session is running, the Application Designer session that is used as a debugger is the first one to be started.
In debug mode, a PeopleCode Editor window opens for every item (for example, record, component, or page) that has PeopleCode in it when that PeopleCode is executed. If a component has more than one event with a PeopleCode program, then only one window opens per item. For example, if you have a record that has PeopleCode in both the SearchSave and RowInit events, only one PeopleCode Editor window opens: first it contains the SearchSave PeopleCode program, and then the RowInit program. If you have PeopleCode in the RowInit event for two different records that are part of the same component, two PeopleCode Editor windows open, one for each RowInit PeopleCode program.
The four types of variables panes are:
Local
Global
Component
Parameter
The Local, Global, and Component variable panes show local, global, and component variables, respectively. The Parameter variable pane shows the value of parameters passed in function declarations.
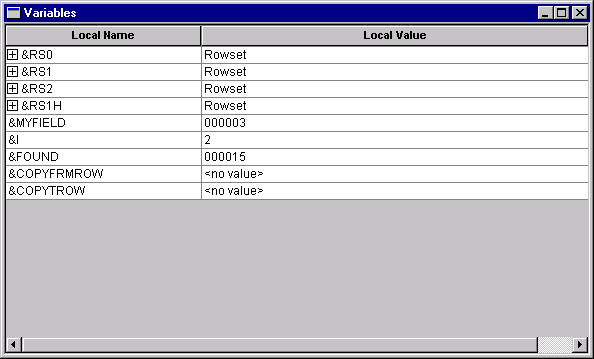
From the variables pane, you can check the value of the variables you have in the program. These values are updated as the code runs. The following example shows the variables pane:
Image: Local Variables pane
This example illustrates the fields and controls on the Local Variables pane. You can find definitions for the fields and controls later on this page.
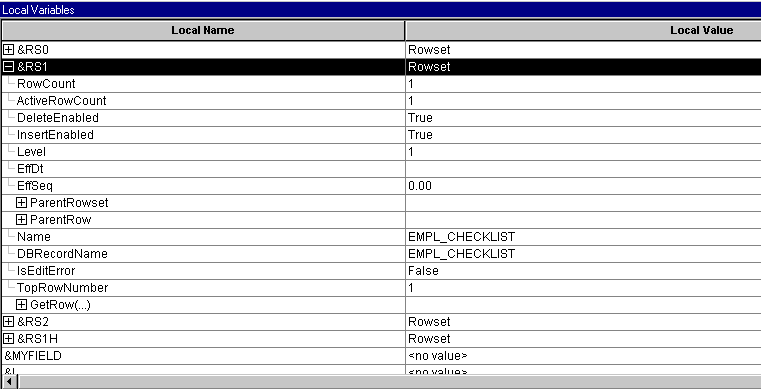
In addition, you can expand any of the objects to see its properties by clicking the plus sign next to the variable name. In the following example, a level one rowset is expanded. You can see the properties, such as ActiveRowCount and DBRecordName, that are part of the rowset.
Image: Local Variables pane with rowset object expanded
This example illustrates the fields and controls on the Local Variables pane with rowset object expanded. You can find definitions for the fields and controls later on this page.
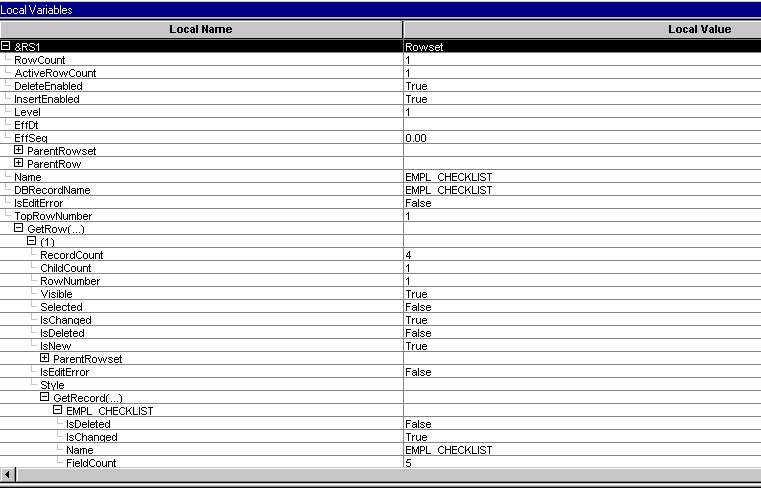
In addition, some objects contain other objects: a rowset contains rows, rows contain records or child rowsets, and records contain fields. You can expand these secondary objects to see their properties. In the following example, the first row of a rowset is expanded, as is the EMPL_CHECKLIST record:
Image: Variable pane with rowset, row, and record expanded (shown with condensed font)
This example illustrates the fields and controls on the Variable pane with rowset, row, and record expanded (shown with condensed font). You can find definitions for the fields and controls later on this page.
Field Values
When you view a field object in the debugger, the value of the field is listed in the Value column. Therefore, you do not have to navigate to the Value property to see the value of a field.
The following example shows the PERSONAL_DATA record and the values of the fields:
Image: PERSONAL_DATA record field values
This example illustrates the fields and controls on the PERSONAL_DATA record field values. You can find definitions for the fields and controls later on this page.
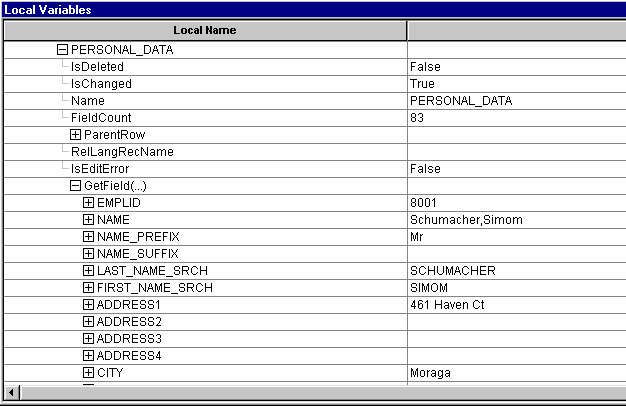
In addition, the only fields that appear in the debugger are the fields that are actually in the Component Buffer. For example, suppose you have a derived work record, but you do not access all the fields in the work record. Only the fields that you access and that are in the Component Buffer actually appear in the debugger.
The Call Stack pane appears by default when the PeopleCode debugger is started. To reopen it, select Debug, View Call Stack Window.
The Call Stack pane displays a stack of PeopleCode functions and methods that are currently active but not completed. You can use the Call Stack pane to observe the flow of an application as it executes a series of nested functions. When a function is called, it is pushed onto the top of the stack. When the function returns, it is popped off the stack.
The Call Stack pane displays the currently executing function at the top of the stack and older function calls below that, in reverse calling order. You can navigate to the source code of a function from the call stack window. The variables panes update to reflect values for the selected function.
The Call Stack pane is updated and usable when execution is stopped at a breakpoint.
Call Stack Indicators
The Call Stack displays a current line indicator and a selected function indicator in the gutter.
The current line indicator is a green arrow that shows where in the call stack the execution stopped. The current line indicator always appears in the call stack pane.
The selected function indicator is a yellow triangle that marks the current function being displayed by the Edit and Variables windows. The selected function indicator does not appear when the current function is at the execution point.
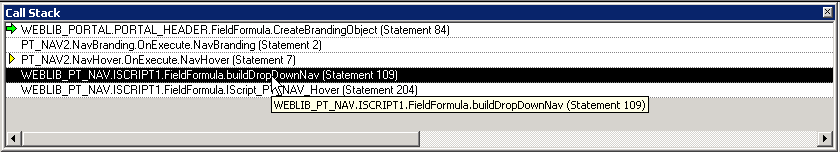
You can hover over a function name to see the full program path in a pop-up window, as shown in the following example.
Image: Call Stack pane example showing execution pointer, selected function indicator, and hover pop-up
This example illustrates the fields and controls on the Call Stack pane example showing execution pointer, selected function indicator, and hover pop-up. You can find definitions for the fields and controls later on this page.
The Call Stack pane is updated, when necessary, with each change of the debug state.
Go To Source Code
Right-click on a function to access a context menu with these options:
|
Options |
Description |
|---|---|
|
Copy |
Copies the text of the selection in the call stack to the clipboard. |
|
Select All |
Selects all rows in the call stack. You can also use standard shift-click and CTRL-click actions to select multiple rows. |
|
Go To Source Code |
Displays the selected function in the Edit window. In addition, the active variables windows will be updated in sync with the Call Stack and Edit windows. Double-click a function name to go to the source code. |
When the displayed source code is at the execution point, the execution pointer icon (green arrow) appears in the source window.
When the displayed source code is not at the execution point, the selected function icon (yellow triangle) appears in the source window.
Image: Source code pane and call stack pane showing the yellow triangle execution pointer
This example illustrates the fields and controls on the Source code pane and call stack pane showing the yellow triangle execution pointer. You can find definitions for the fields and controls later on this page.
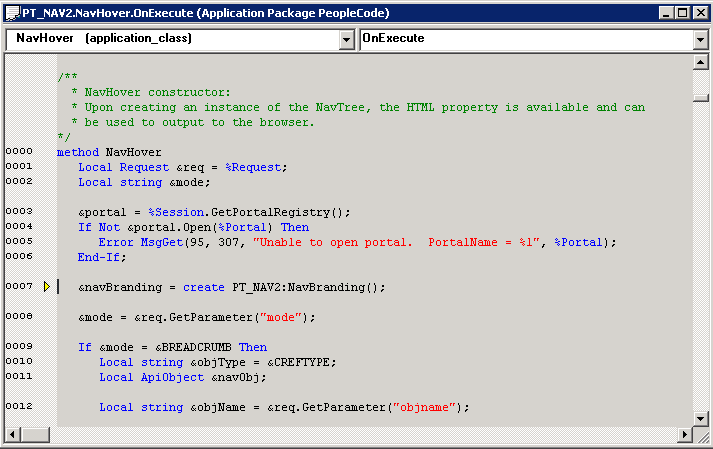
Viewing source code for functions that are not at the top of the stack does not change the point of execution. Nor does it disable the ability to continue execution. For example, in the previous example, selecting Go would cause the program execution to continue at “FUNCLIB_PORTAL.PORTAL_GEN_FUNC.FieldFormula PortalOpen” and not at the function in the source code window.
During debugging it is easier to go back to the previous code event from the call stack window as compared to trying to keep track of where the control was transferred and then finding the right opened PeopleCode window in Application Designer. This can be useful when trying to understand the component design and PeopleCode flow.
Setting the value of a variable or property in the debugger gives you the flexibility to try out changes and see the results in real time or to recover from a logic error and continue.
You can change the value of variables or properties in the Local Variables, Component Variables, Function Parameters, and Component Buffers panes. Only variables or properties with conventional data types (Any, Boolean, Date, DateTime, Float, Integer, Number, String, Time) can by changed. You cannot assign a new object to an object variable. Values that are not editable appear on a gray background.
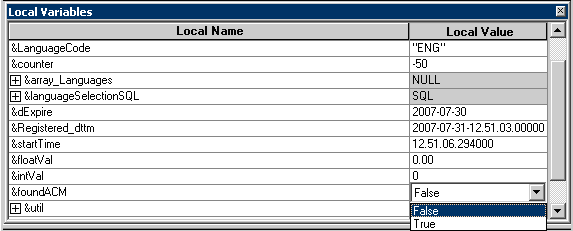
While the debugger is running and halted at a breakpoint, select a field in the value column, such as the Local Value column in the example, and revise the value.
Image: Local Variables pane showing a drop-down list to set the value for a Boolean variable
This example illustrates the fields and controls on the Local Variables pane showing a drop-down list to set the value for a Boolean variable. You can find definitions for the fields and controls later on this page.
The debugger performs data type checking to prevent entry of incorrect data type values. For example, character strings are not allowed for integer data types, and so on. However, data integrity is not verified, so be aware that changing variable values at runtime can corrupt program execution as well as program data. For example, setting an integer value higher than what is permitted in the function could cause a crash when execution continues. It is the developer’s responsibility to enter an appropriate value.
Modifying a variable in a debugger pane changes the value in memory only. The change does not trigger any PeopleCode events and does not cause any PeopleCode flags to be set.
The following are general tips for debugging your application:
If you are having problems determining if the correct data is being loaded into the component buffers, use the View Component Buffers view window to see all the values currently in the component buffer.
This is equivalent to putting a GetLevel0 function at the start of a program.
Use the &LEVEL0 variable to navigate through all the levels of the rowset object, see the row, records, fields, and so on. This shows you everything that has been loaded into the component buffers for that component.
While at a breakpoint, if you lose track of the window, or the location within the window, that is displaying the green execution location arrow, you can use the Execution Location Properties menu item’s ViewCode button to find your current execution location again.
Objects remain expanded in the variable windows as you move through PeopleCode.
This enables quick inspection of the state of an object as you step through the PeopleCode. However, there is a performance cost for using this feature. If you are finished examining an object, you may want to collapse it to improve the response speed.
If a database transaction has been started (either for you by PeopleTools, or by you in PeopleCode) other users of that database are blocked from accessing that database until the transaction is complete.
If you are stepping through PeopleCode while this transaction is open, you could potentially block other users for an extended period of time. You may want to use a private database for debugging to avoid blocking other users.
Using the debugger is resource intensive and will impact overall system performance. Oracle recommends that you do not run debugger on your production system unless the issue you are trying to debug cannot be replicated in any other environment. If that is the case, debug when there is the least activity on the system. As an alternative you can try PeopleCode tracing.
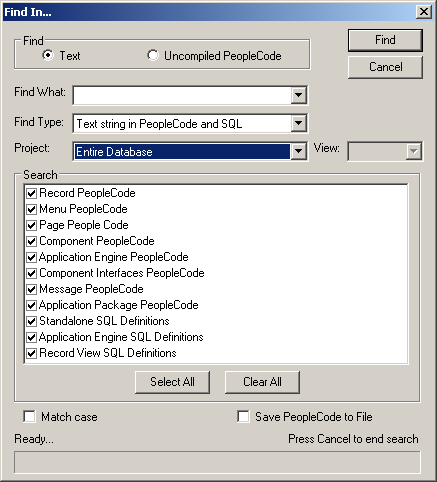
To create a file that contains all the PeopleCode for a project (or database), use the Find In feature and search for
;.Be sure to select Save PeopleCode to File.
The following example shows the Find In dialog box:
Image: Find In dialog box
This example illustrates the fields and controls on the Find In dialog box. You can find definitions for the fields and controls later on this page.
See Using the Find In Feature.
DoModal Considerations
If you set the PeopleCode debugger to break at start and you are using the DoModal PeopleCode function, the DoModal window may appear behind the PeopleCode debugger window. The debugger may appear to have stopped, but it has not. Be sure to check that other windows have not opened while you are debugging the code.