Using the Spark Chart Classes
Spark charts are used to visualize the trend of a data set in a compact form factor. They are best used to view trends over time, especially when paired with additional context such as in a table. Absolute values and individual data points are not emphasized, so spark charts should not be used to visualize data where such things are important.
While the typical chart is designed to show as much data as possible, spark charts are intended to be succinct, memorable, and located where they are discussed.
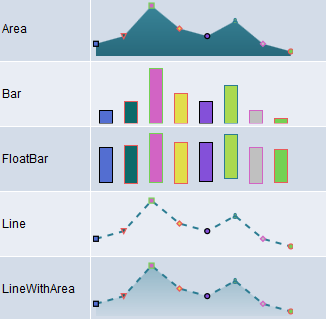
Image: Spark chart examples
The following example illustrates five spark chart types: an area chart, a bar chart, a floating bar chart, a line chart, and a line with area chart.
Spark charts should be used to convey trend and relative change, not detail values. The spark chart does not have axis labels or any other text. Thus, the axes must be intuitive to the viewer. In a spark chart, the y-axis is almost always numerical and the x-axis is either numerical or a time series.
A typical example of a spark chart is a stock pricing chart. In PeopleSoft applications, spark charts might be good for showing data such as general ledger account balances over time or a grid displaying employee vacation balances over time.
Typically, spark charts are defined as interactive, so that clicking or touching one would take the user to more detail. You can define the interaction result to be a URL or a PeopleCode program.
To create a spark chart on a page you need to:
Place a chart control on a page in Application Designer.
Create an instance of the SparkChart class in PeopleCode.
&aS = GetSparkChart(RECORD_NAME.FIELD_NAME);Create one or more instances of the SparkChartItem class in PeopleCode.
&aS1 = GetSparkChartItem();Add those SparkChartItem instances to an array.
Associate the array to the SparkChart class instance.
&aS.SetSparkChartItems(CreateArray(&aS1, &aS2, ...));
Image: Example of the five spark chart types
The following example displays the five spark chart types: bar chart, line chart, area chart, line with area chart, and floating bar chart.
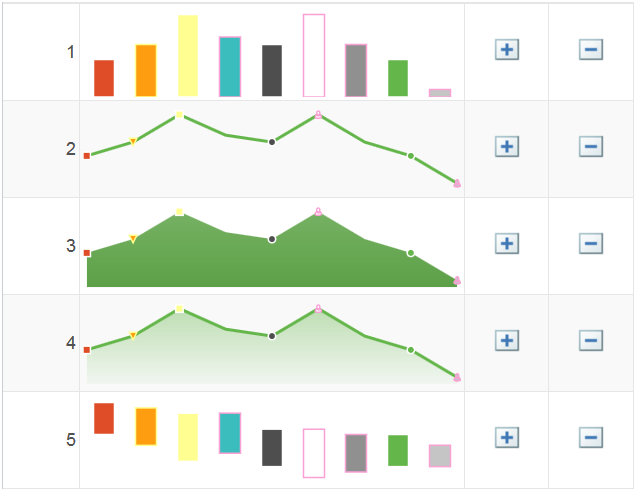
The following PeopleCode example was used to generate the preceding spark charts. The properties for each spark chart item determine its value, color, marker type, and so on.
Local SparkChart &aS;
Local SparkChartItem &aS1, &aS2, &aS3, &aS4, &aS5, &aS6, &aS7, &aS8, &aS9;

&aS = GetSparkChart(QE_DVTSCR_WRK.QE_CHRT1);

&aS1 = GetSparkChartItem();
&aS1.Value = 60;
&aS1.FloatValue = 60;
&aS1.Color = 10;
&aS1.BorderColor = 18;
&aS1.MarkerDisplayed = True;
&aS1.MarkerShape = %SparkMarker_Square;


&aS2 = GetSparkChartItem();
&aS2.Value = 70;
&aS2.FloatValue = 40;
&aS2.Color = 8;
&aS2.BorderColor = 11;
&aS2.MarkerDisplayed = True;
&aS2.MarkerShape = %SparkMarker_TriangleDown;

&aS3 = GetSparkChartItem();
&aS3.Value = 90;
&aS3.FloatValue = 10;
&aS3.Color = 11;
&aS3.BorderColor = 18;
&aS3.MarkerDisplayed = True;
&aS3.MarkerShape = %SparkMarker_Auto;


&aS4 = GetSparkChartItem();
&aS4.Value = 75;
&aS4.FloatValue = 25;
&aS4.Color = 2;
&aS4.BorderColor = 9;
&aS4.MarkerDisplayed = False;
&aS4.MarkerShape = %SparkMarker_Diamond;

&aS5 = GetSparkChartItem();
&aS5.Value = 70;
&aS5.FloatValue = 0.1;
&aS5.Color = 3;
&aS5.BorderColor = 18;
&aS5.MarkerDisplayed = True;
&aS5.MarkerShape = %SparkMarker_Circle;


&aS6 = GetSparkChartItem();
&aS6.Value = 90;
&aS6.FloatValue = - 20;
&aS6.Color = 68;
&aS6.BorderColor = 9;
&aS6.MarkerDisplayed = True;
&aS6.MarkerShape = %SparkMarker_Human;

&aS7 = GetSparkChartItem();
&aS7.Value = 70;
&aS7.FloatValue = - 10;
&aS7.Color = 4;
&aS7.BorderColor = 9;
&aS7.MarkerDisplayed = False;
&aS7.MarkerShape = %SparkMarker_Diamond;

&aS8 = GetSparkChartItem();
&aS8.Value = 60;
&aS8.FloatValue = 0.1;
&aS8.Color = 5;
&aS8.BorderColor = 18;
&aS8.MarkerDisplayed = True;
&aS8.MarkerShape = %SparkMarker_Circle;


&aS9 = GetSparkChartItem();
&aS9.Value = 40;
&aS9.FloatValue = 0.1;
&aS9.Color = 6;
&aS9.BorderColor = 9;
&aS9.MarkerDisplayed = True;
&aS9.MarkerShape = %SparkMarker_Human;


&aS.Width = 200;
&aS.AspectRatio = 0.3;

&aS.AnimationDuration = 1;
&aS.AnimationType = 1;


Local integer &row;
&row = CurrentRowNumber();
Evaluate &row
When 1
   &aS.Type = %SparkChart_Bar;
When 2
   &aS.Type = %SparkChart_Line;
When 3
   &aS.Type = %SparkChart_Area;
When 4
   &aS.Type = %SparkChart_LineWithArea;
When 5
   &aS.Type = %SparkChart_FloatingBar;
End-Evaluate;

&aS.IsDrillable = True;
&aS.LineType = %SparkLine_Straight;
&aS.LineStyle = %SparkLineStyle_Solid;
&aS.barGapRatio = 0.5;
&aS.LineWidth = 2;
&aS.SparkChartURL = "www.yahoo.com";
&aS.Title = "spark title2";
&aS.Color = %ChartColor_Green;

&aS.SetSparkChartItems(CreateArray(&aS1, &aS2, &aS3, &aS4, &aS5, &aS6, &aS7, &aS8, &aS9));