Defining Batch Timings
This section provides an overview of batch timings and discusses how to define batch timings.
Batch Timings reports are provided so that you can monitor the performance of your application engine programs. The Process Scheduler - Batch Timings page applies to the Statement Timings data that is stored in the (table) option.
For the Batch Timings feature to record data, you must enable it using the Configuration Manager Trace tab. In the Application Engine group, select the Statement Timings (table) option.
Note: Whenever you run an application engine program and the Statement Timings trace options are enabled, you can always view the batch timings results using the Process Monitor.
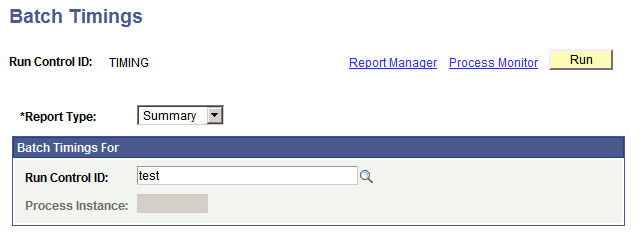
To access the Batch Timings page, select
Image: Batch Timings page
This example illustrates the fields and controls on the Batch Timings page. You can find definitions for the fields and controls later on this page.
|
Field or Control |
Definition |
|---|---|
| Run Control ID |
Displays the run control ID that is used to run the Batch Timings report. |
| Report Type |
Select the type of report that you want to generate, based on the data that is stored in the batch timings table. Summary: Provides a report of all of the runs that are initiated by a run control ID. The Process Instance field is unavailable when this option is selected. Detail: Provides a report of a specific run or process instance of an application engine program. The Run Control ID field is unavailable when this option is selected. |
Batch Timings For
Based on the report type that you selected, enter the run control ID or process instance.