Viewing the Elasticsearch Cluster Dashboard
In PeopleSoft Health Center, the Application Dashboard is the principal dashboard that provides a snapshot or summary of the health of the domains and the Elasticsearch cluster. Detailed information of the Elasticsearch cluster is available on a dashboard, which you access by clicking the Elasticsearch cluster.
This topic describes the snapshot of an Elasticsearch cluster available on the Application Dashboard.
Access the Application Dashboard (PeopleTools, Health Center, Health Center).
Image: Application Dashboard - ES Cluster Summary section
This example illustrates the fields and controls on the Application Dashboard - ES Cluster Summary section. You can find definitions for the fields and controls later on this page.
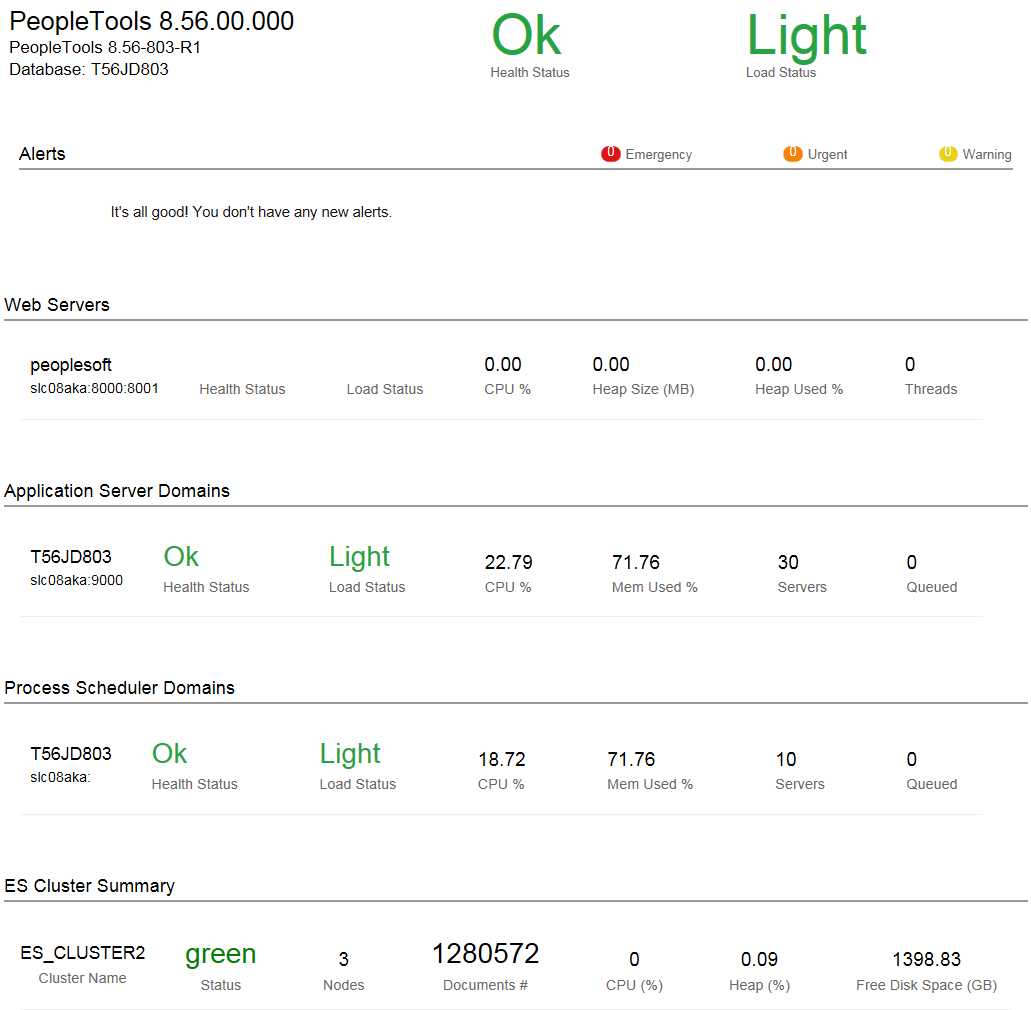
In PeopleSoft Health Center, the Application Dashboard displays a summary of the Elasticsearch cluster that includes the following information.
|
Field or Control |
Definition |
|---|---|
| Cluster Name |
The name of the Elasticsearch cluster. You specify a cluster name when you install Elasticsearch. To change the cluster name, you need to specify a new name in the elasticsearch.yml configuration file. |
| Status |
The health status of the Elasticsearch cluster is indicated by the following color codes:
|
| Nodes |
Total number of nodes in the cluster. |
| Documents # |
Total number of documents in the cluster. |
| CPU (%) |
CPU utilization (in percentage) by JVM. |
| Heap (%) |
Total of average JVM percent used in the cluster. |
| Free Disk Space (GB) |
Available disk space for the entire cluster. |
While the ES Cluster Summary section in the Application Dashboard provides a high-level status of the cluster, the Cluster Details page provides detailed information on the cluster, nodes and indices.
Access the Cluster Details page (PeopleTools, Health Center, Health Center and on the Application Dashboard, click any of the ES Cluster Summary values).
Image: Cluster Details page
This example illustrates the fields and controls on the Cluster Details page. You can find definitions for the fields and controls later on this page.
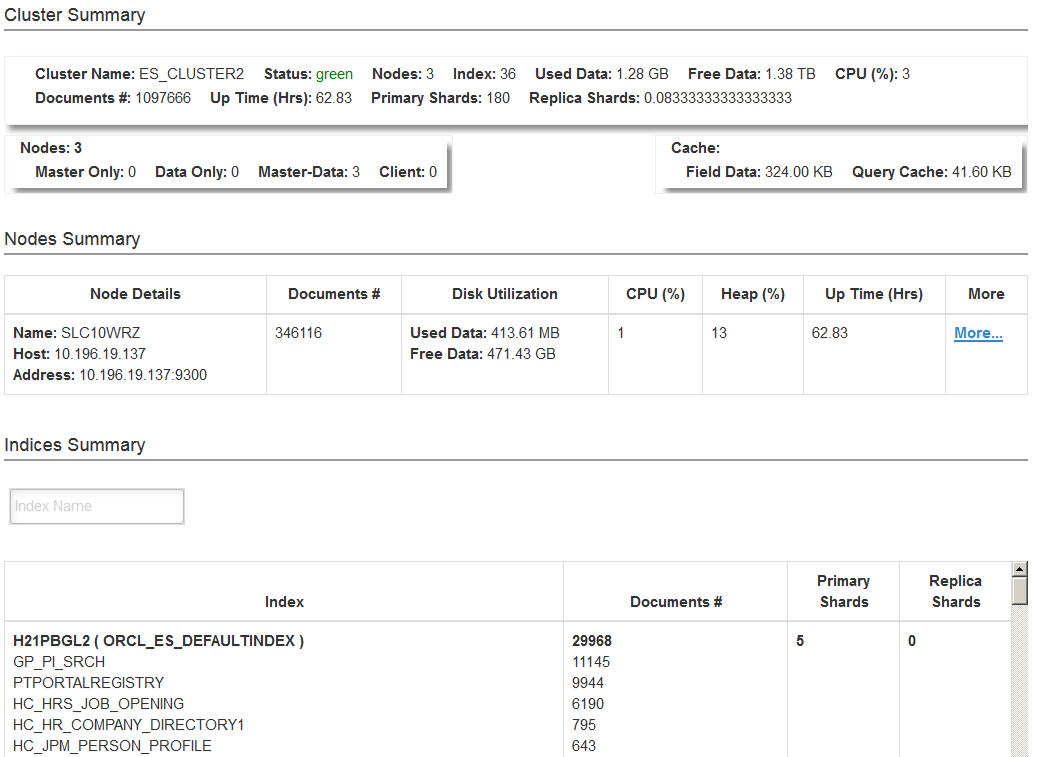
The Cluster Details page provides information on the cluster, nodes, and indices.
Cluster Summary
|
Field or Control |
Definition |
|---|---|
| Cluster Name |
The name of the Elasticsearch cluster. |
| Status |
Health status of the cluster is color coded - Green, Yellow, Red. |
| Nodes |
The total number of nodes in the cluster. |
| Index |
The total number of indexes in the cluster. |
| Used Data |
Indicates the memory used by the cluster. |
| Free Data |
Indicates the available memory in the cluster. |
| CPU% |
The percentage of CPU used by JVM. |
| Documents # |
Total number of documents in the cluster. |
| Up Time (Hrs) |
Total time in hours since the cluster is up. |
| Primary Shards |
Total number of primary shards in the cluster. |
| Replica Shards |
Total number of replica shards in the cluster. |
| Nodes |
Displays a breakdown of the nodes:
|
| Cache |
|
Nodes Summary
|
Field or Control |
Definition |
|---|---|
| Nodes Details |
Contains details of the node name, the host information, and the address. |
| Documents # |
Total number of documents in a node. |
| Disk Utilization |
Contains information on used memory and available memory. |
| CPU (%) |
The percentage of CPU utilization by the node. |
| Heap (%) |
Percentage of JVM used by the node. |
| Up Time (Hrs) |
Time in hours since the host is up and running. |
Indices Summary
|
Field or Control |
Definition |
|---|---|
| Index |
The name of the index. |
| Documents # |
Total number of documents residing in an index and the number of documents in a search definition. |
| Primary Shards |
Number of primary shards. You specify the number of primary shards in the General Options page. See Managing General Search Options for more information on the use of primary shards. |
| Replica Shards |
Number of replica shards. You specify the number of replica shards in the General Options page. See Managing General Search Options for more information on the use of replica shards. |