Viewing the Node Dashboard
Elasticsearch provides an array of statistics of each node in a cluster. Depending on your implementation of the search functionality, you can have multiple nodes within the Elasticsearch cluster.
Access the Node Details page (PeopleTools, Health Center, Health Center, and on the Cluster Details page, click the More link for a node).
For debugging purposes, you may refer to Elasticsearch: The Definitive Guide [2.x], Administration, Monitoring, and Deployment on the Elasticsearch website (www.elastic.co).
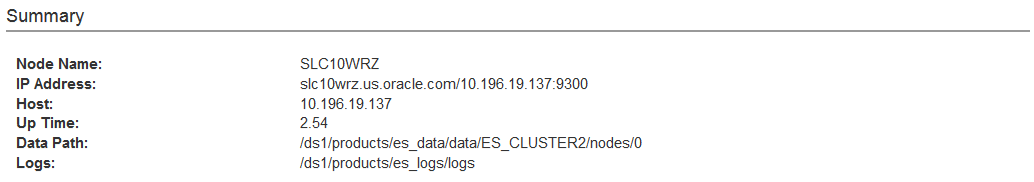
The Summary section of the node dashboard provides general information on the Elasticsearch server, which are useful for debugging purposes.
Image: Summary section
This example illustrates the fields and controls on the Summary section. You can find definitions for the fields and controls later on this page.
|
Field or Control |
Definition |
|---|---|
| Node Name |
The name of the node in the Elasticsearch cluster. |
| IP Address |
IP address of the node. |
| Host |
Host address. |
| Up Time |
Number of hours the node is up and running in the cluster. |
| Data Path |
Location of the cluster data. |
| Logs |
Location of the Elasticsearch logs. |
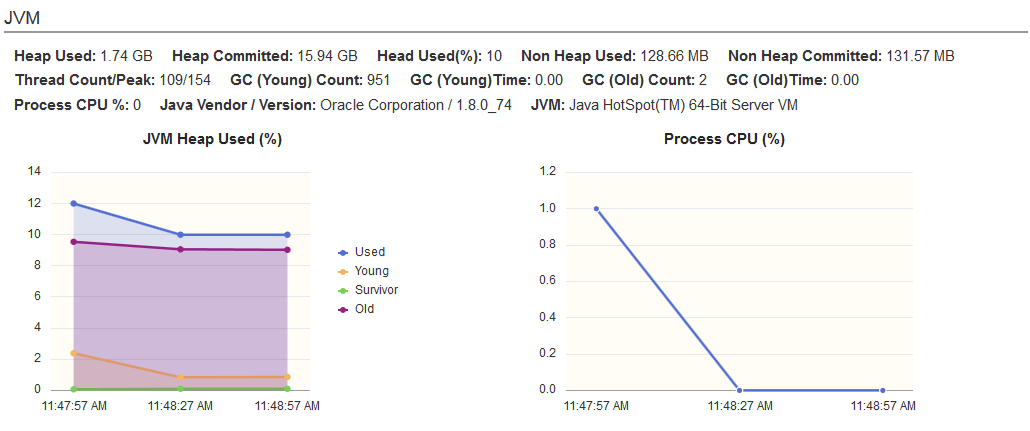
The JVM section of the node dashboard provides critical information about the JVM that is running the Elasticsearch server.
Image: JVM section
This example illustrates the fields and controls on the JVM section. You can find definitions for the fields and controls later on this page.
|
Field or Control |
Definition |
|---|---|
| Heap Used |
The amount of heap memory used by JVM. |
| Heap Committed |
The amount of memory actually allocated to the JVM process. |
| Heap Used (%) |
The amount of heap memory used by JVM in percentage. Elasticsearch initiates garbage collections when the heap percentage is 75%. Note: If the heap used percentage is consistently greater than or equal to 75%, it is a warning sign that slow garbage collections may occur. If the heap used percentage is consistently greater than or equal to 85%, you need to increase the memory (maximum of 30 GB per node) or add nodes to the cluster. If heap used percentage is greater than 90–95%, risk of very poor performance that may result in very slow garbage collections and out of memory exceptions. For more information on heap used percentage, see Elasticsearch: The Definitive Guide [2.x], Monitoring Individual Node on the Elasticsearch website (www.elastic.co). |
| Non Heap Used |
Non heap memory is where classes are loaded and is controlled by JVM application automatically. This parameter shows how much non-heap memory is used. |
| Non Heap Committed |
The amount of non heap memory allocated. |
| Thread Count/Peak |
JVM Thread count and peak count. |
| GC (Young) Count |
Shows the garbage collections count for the Young generation. This is usually large. |
| GC (Young) Time |
Shows the garbage collections cumulative time in milliseconds for the Young generation. |
| GC (Old) Count |
Shows the garbage collections count for the Old generation. This value should be small. For more details on garbage collections, see Elasticsearch: The Definitive Guide [2.x], Monitoring Individual Node on the Elasticsearch website (www.elastic.co). |
| GC (Old) Time |
Shows the garbage collections cumulative time in milliseconds for the Old generation. The garbage collection time should be small. Note: Search administrators much periodically collect garbage collection counts and time. |
| Process CPU % |
CPU usage in percentage. A chart also displays the CPU usage percentage. |
| Java Vendor/Version |
Displays the vendor and version for Java. |
| JVM |
Displays generic information about the JVM. |
| JVM Heap Used (%) |
The chart displays breakdown of memory usage by each generation — Young, Survivor, Old. |
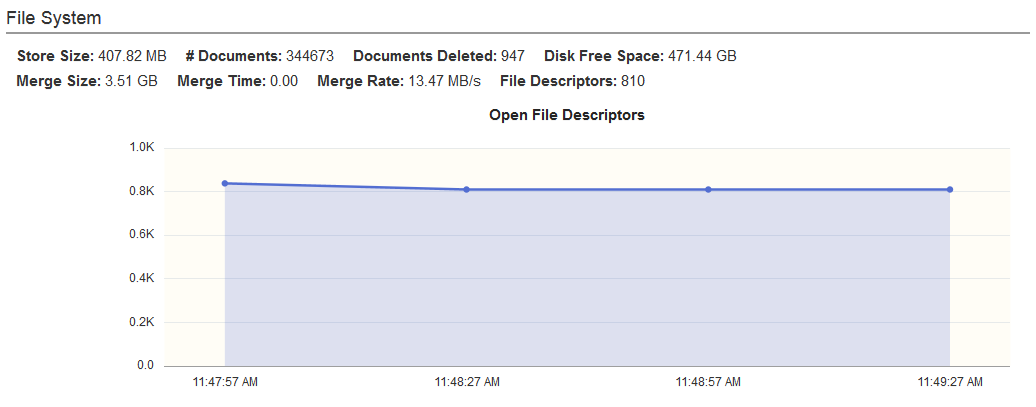
The File System section provides statistics on the file system in the node.
Image: File System section
This example illustrates the fields and controls on the File System section. You can find definitions for the fields and controls later on this page.
|
Field or Control |
Definition |
|---|---|
| Store Size |
Physical storage consumed by the node. It includes both primary and replica shards. |
| # Documents |
Total number of documents that reside on the node. |
| Documents Deleted |
Number of deleted documents that are not purged from the segments yet. |
| Disk Free Space |
Free space available in the node. |
| Merge Size |
Shows the cumulative size of segments being merged. |
| Merge Time |
Shows the time taken to complete the merge. |
| Merge Rate |
Shows the rate at which the merge is completed. |
| File Descriptors |
Shows the number of opened file descriptors associated with the current process. |
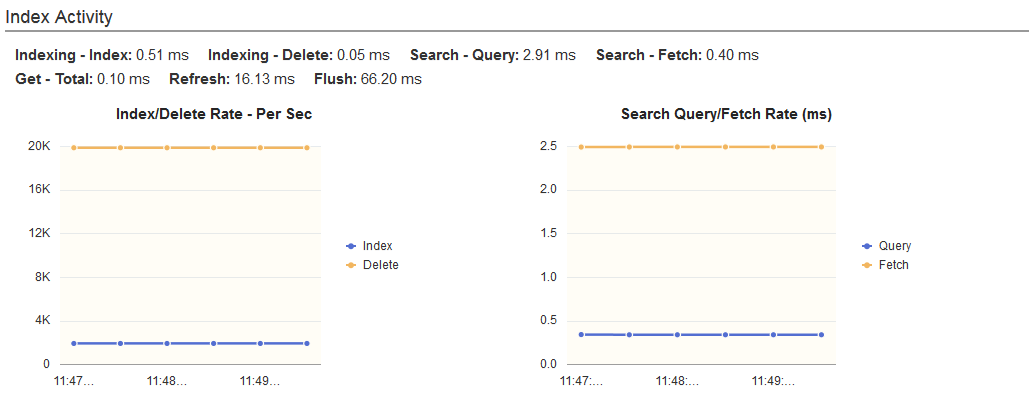
The Index Activity section provides aggregate statistics for all indices on the node.
Image: Index Activity section
This example illustrates the fields and controls on the Index Activity section. You can find definitions for the fields and controls later on this page.
|
Field or Control |
Definition |
|---|---|
| Indexing - Index |
Shows the average time taken for indexing in milliseconds. |
| Indexing - Delete |
Shows the average time taken (in milliseconds) for deleting documents from an index. |
| Search - Query |
Shows the average time spent on queries (per request) since the node was started. If query time is high, you may need to tune or optimize your search server and optimize your queries too. For more details, see Elasticsearch: The Definitive Guide [2.x], Monitoring Individual Node on the Elasticsearch website (www.elastic.co). |
| Search - Fetch |
Shows the average time taken to fetch data as part of the query process. If the fetch time is more than the query time, it may indicate slow disks or that large documents are fetched. |
| Get - Total |
Shows the average time taken (in milliseconds) for Get requests. |
| Refresh |
Shows the average time taken (in milliseconds) to refresh requests. |
| Flush |
Shows the average time taken (in milliseconds) for each of the flush requests. |
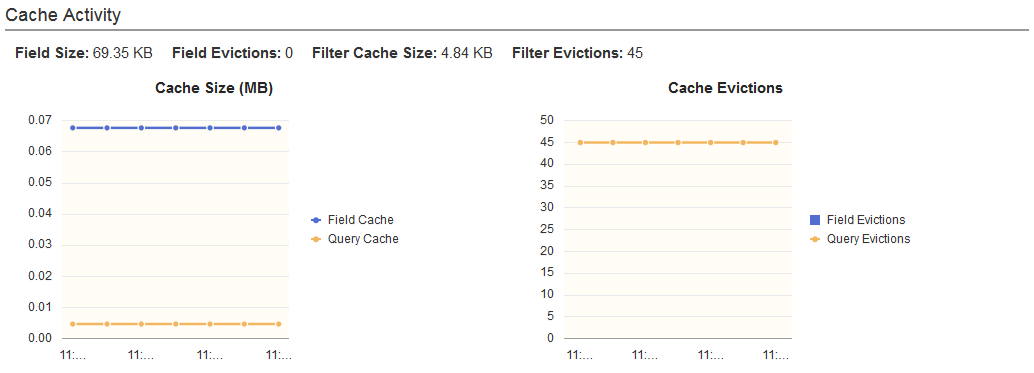
The Cache Activity section displays details of the cache in the node.
Image: Cache Activity section
This example illustrates the fields and controls on the Cache Activity section. You can find definitions for the fields and controls later on this page.
|
Field or Control |
Definition |
|---|---|
| Field Size |
Shows the memory used by field data, which is used for aggregations, sorting, and so on. |
| Field Evictions |
Shows the number of times a field has been evicted. This value should be zero or a value close to zero. |
| Filter Cache Size |
Shows the amount of memory used by cached filter bitsets. |
| Filter Evictions |
Shows the number of times a filter has been evicted. |
| Cache Size |
The allocated memory for cache. |
| Cache Evictions |
Shows the number of times a query cache has been evicted to make way for new data. |
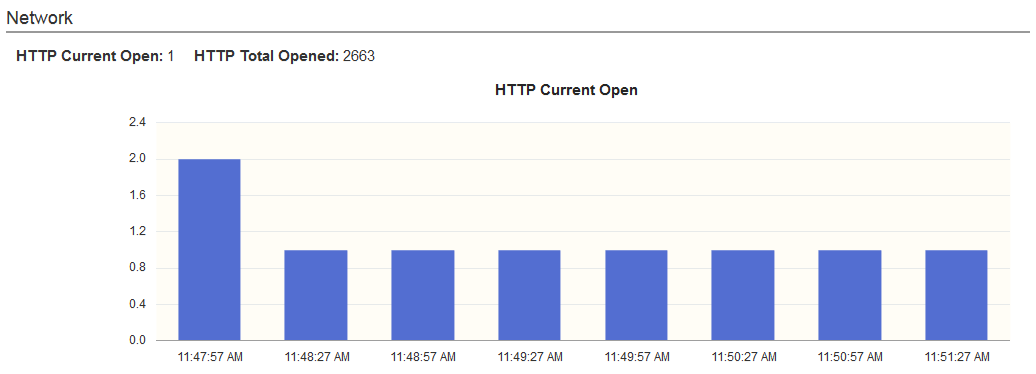
The Network section provides statistics of the HTTP port (usually 9200).
Image: Network section
This example illustrates the fields and controls on the Network section. You can find definitions for the fields and controls later on this page.
|
Field or Control |
Definition |
|---|---|
| HTTP Current Open |
Shows the number of HTTP clients currently open. |
| HTTP Total Opened |
Shows the total number of HTTP clients opened. If this value keeps increasing constantly, you need to be aware that the HTTP clients may not be configured correctly, that is, the HTTP clients may be not using keep-alive connections, which is necessary for better performance. |