Creating and Using Simplified Analytic Reports
After enabling the Simplified Analytics feature of a component, users use the My Analytics section in the right panel of the component to access the Simplified Analytics Wizard and create, edit, or view the analytic reports.
Note: If you access a component with analytics and related information enabled as a master-detail or activity guide target, make sure that the No System Side page option in the component property of the master-detail component or the activity guide step component is selected. If the No System Side page option is not selected, the side page with analytics and related information will not appear when you access the component as part of a master detail target or activity guide step.
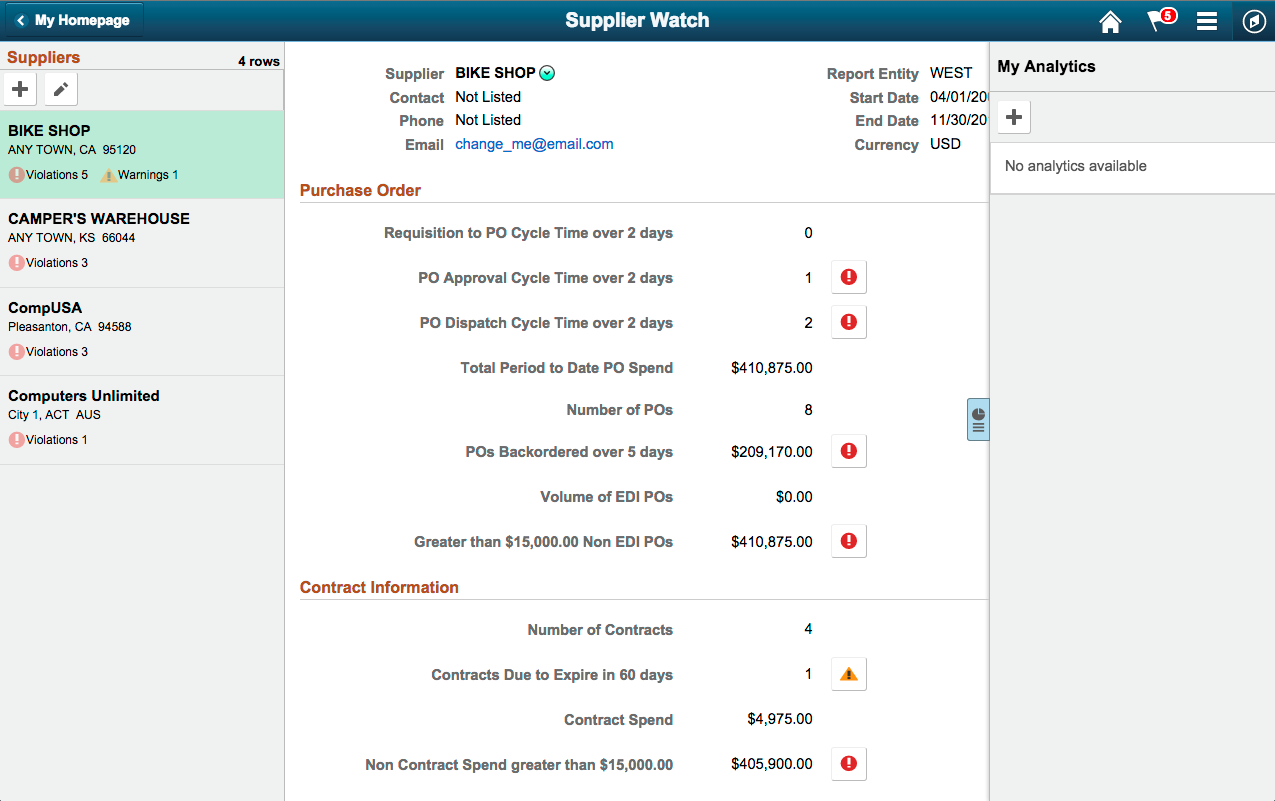
Image: Supplier Watch component in fluid view
This example illustrates the Supplier Watch component. The My Analytics section is available in the right panel.
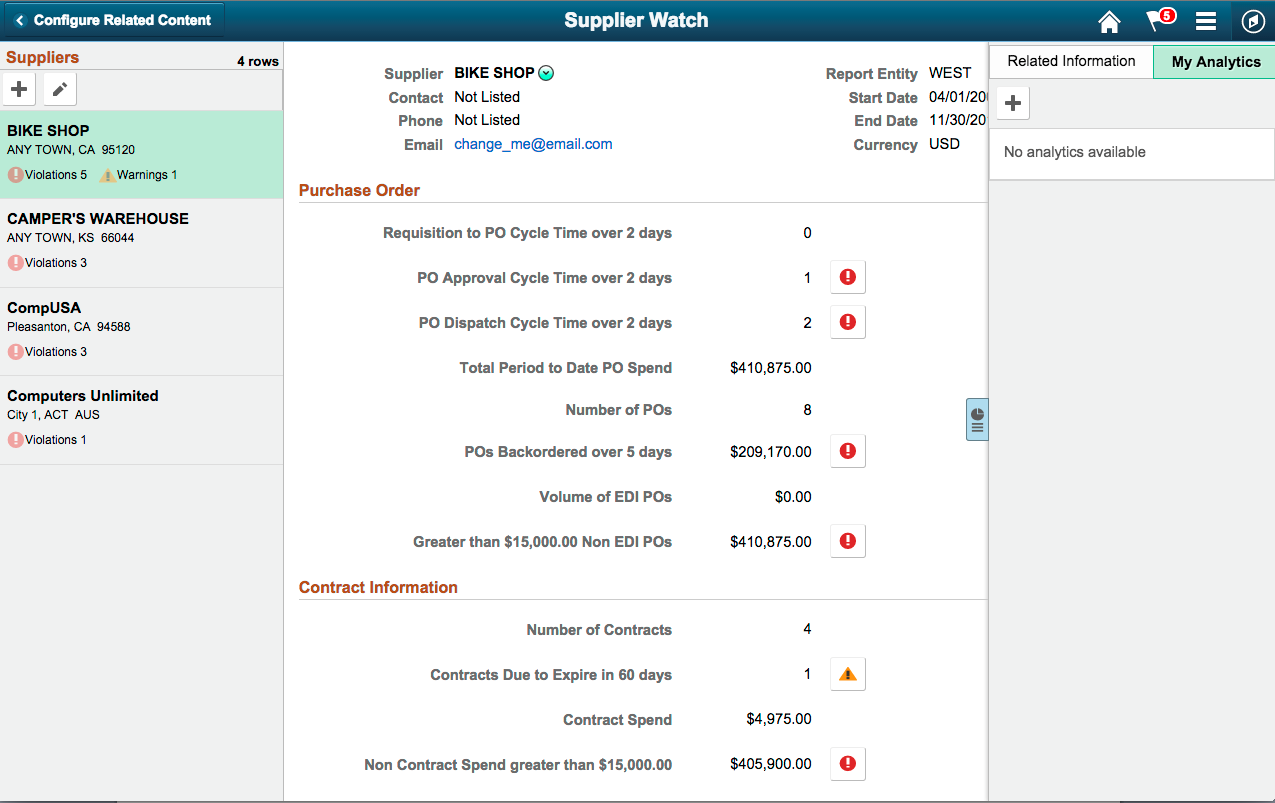
When both component-level related information and Simplified Analytics are configured for the component, the right panel of the window has two tabs: Related Information and My Analytics.
Image: Supplier Watch component - Related Information and My Analytics tabs
This example illustrates the Supplier Watch component. The Related Information and My Analytics tabs are available in the right panel.
When no analytic reports are available, the My Analytics section displays No analytics available. You can use the Add (+) button next to the title of the My Analytics section to create new analytic report or report templates.
When no templates are available to the user, the system does not display the My Analytics section/tab.
Create Analytics Wizard - Step 1
Use the Create Analytics Wizard - step 1 (PTPG_REPORT_WIZ_1) to specify the names of the analytic reports, select the analytic report template and select the display options that will be used to create the analytic report.
Navigation
Access the Create Analytics Wizard - step 1 by clicking the Add (+) button from the My Analytics section in fluid view.
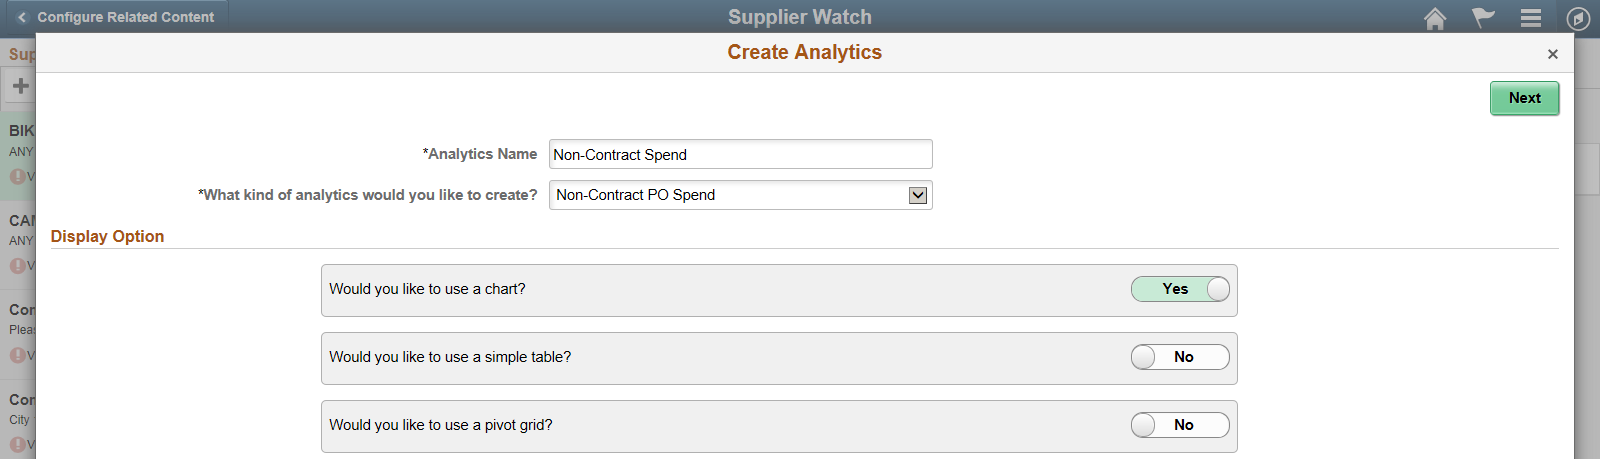
Image: Create Analytics Wizard - step 1
This example illustrates the fields and controls on the Create Analytics Wizard - step 1. Definitions for the fields and controls appear following the example.
|
Field or Control |
Definition |
|---|---|
| Analytics Name |
Enter a name for the analytic report. |
| What kind of analytics would you like to create? |
Displays the available analytic templates that are used to create the analytic report. The template you select from this list determines the fields and prompts in the next step of the wizard, Create Analytics - step 2. Note: This drop-down list is not available when only one template is available. |
| Display Option |
Define the display options for the analytic reports. The available options and combinations are:
|
| Next |
Click to advance the wizard to the next page. |
Create Analytics Wizard - Step 2
Use the Create Analytics Wizard - step 2 (PTPG_REPORT_WIZ_2) to select the fields for the analytic reports and to change the default values of the prompt fields.
Note: This page displays only the prompts that are set to Visible in the base report template.
Navigation
From the Create Analytics Wizard - step 1, click the Next button.
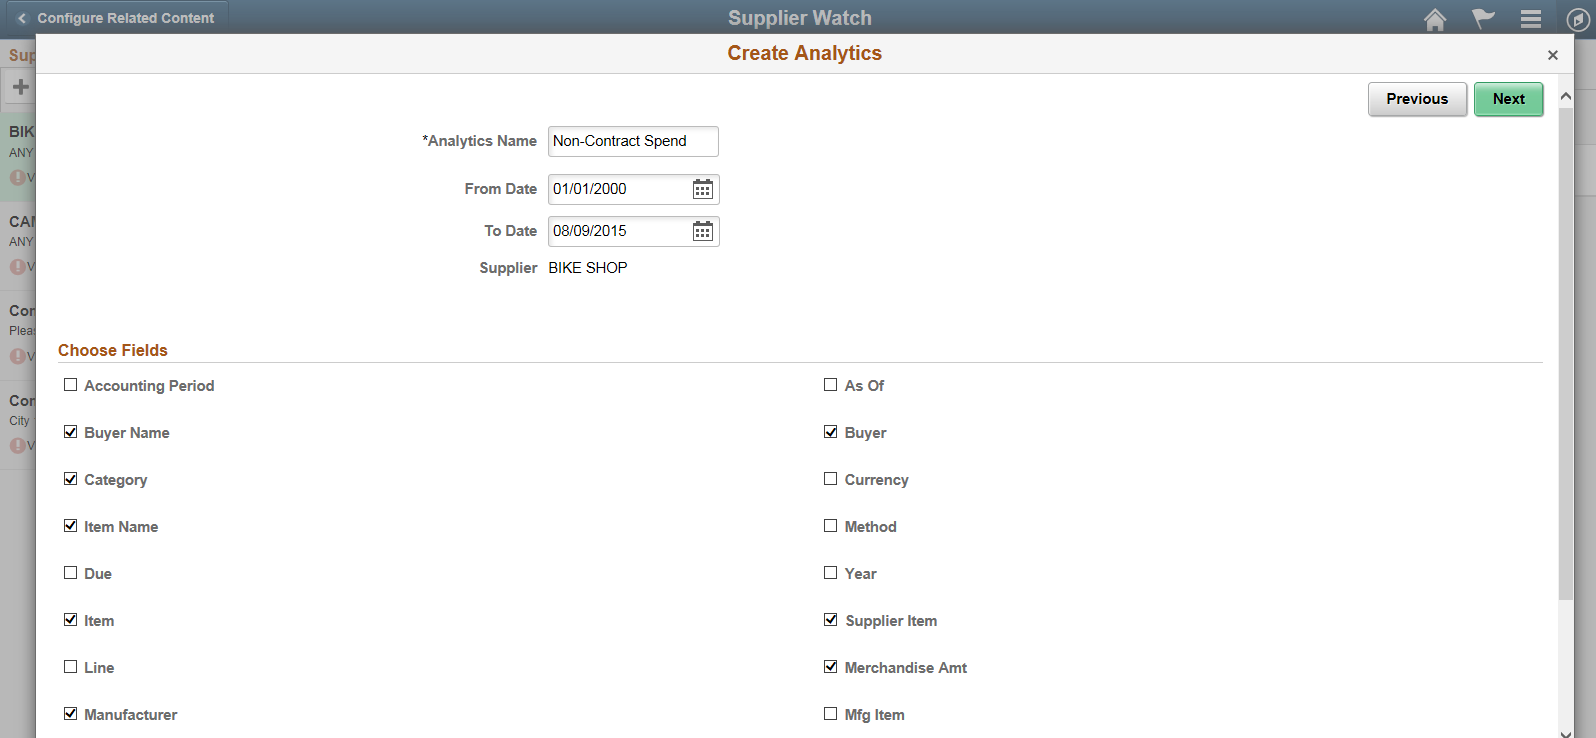
Image: Create Analytics Wizard - Step 2
This example illustrates the Create Analytics Wizard - step 2. Definitions for the fields and controls appear following the example.
|
Field or Control |
Definition |
|---|---|
| From Date, To Date, and Supplier |
In this example, the From Date, To Date, and Supplier fields appear based on the parameters set in the Related Content configuration. These prompts are defined in the Pivot Grid based template model. Note: The Supplier field is read-only because the value for this field is implicitly passed from the transaction page because of the related content configuration. |
| Choose Fields |
Use this section to select the fields that will appear in the analytic reports. Some fields are preselected because those fields form a part of rows/columns/axis/filters in the base template model. |
| Previous |
Click to go back to the Create Analytics Wizard - step 1. |
| Next |
Click to advance the wizard to the next page, where you can preview the display of the analytic reports. |
Create Analytics Wizard - Step 3
Use the Create Analytics Wizard - step 3 (PTPG_REPORT_WIZ_3) to preview the analytic reports based on the display options, fields, and prompts selected in the previous steps of the wizard. Optionally, you can modify (by dragging and dropping, applying filters, and so on) the analytic reports to finalize the design and then click the Save button to save the final report.
Navigation
From the Create Analytics Wizard - step 2, click the Next button.
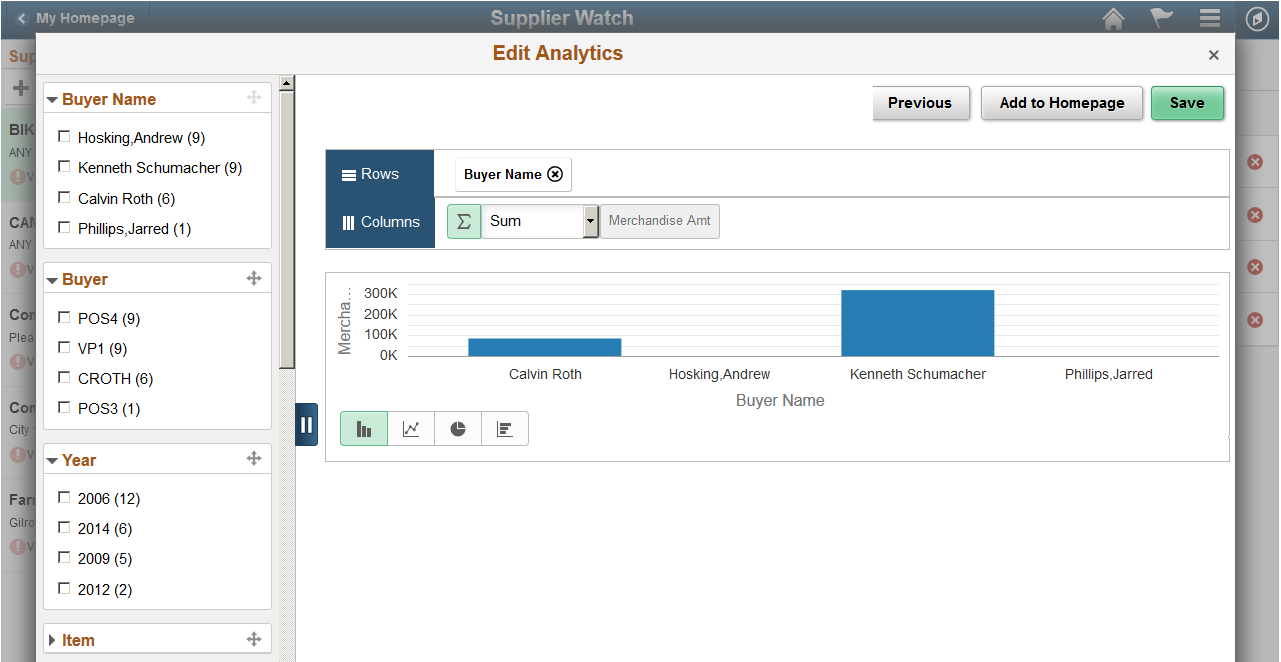
Image: Create Analytics Wizard - step 3
This example illustrates the preview window of the analytic report, Create Analytics Wizard - step 3.
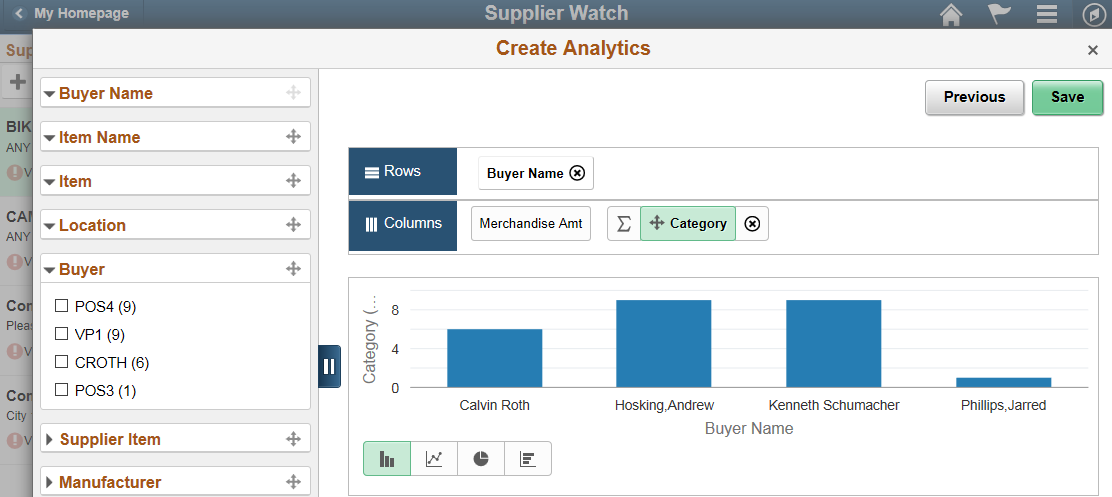
From the preview window, you can:
Change the X-axis, Series, and Y-axis by dragging and dropping these dimensions from the facet area to the row or column section.
Change the chart type by using the chart type short cut icons.
Change the aggregate functions in the Columns area using the Aggregate drop-down list.
Apply facet values.
Use the Save button to save the analytic reports, which are listed under the My Analytics section of the component.
If you are an administrator or super user, saving the analytic report enables the Publish Options button, which you can use to publish the analytic reports to the My Analytics section or the Tile repository of all users of the component.
If you are not an administrator or super user, saving the analytic report enables the Add to Homepage button, which you can use to add the analytic report to the fluid homepage.
Note: The Create Analytics Wizard - step 3 does not display the editable facets. If you select a field that is used as an editable facet, that facet is displayed only when you view the analytic report.
Administrators or super users use the Publish Options page (PTPG_REPORT_WIZPUB) to publish the analytic reports that they created to other users.
Navigation
Click the Publish Options button from the Create Analytics Wizard - step 3.
Note: The Publish button is available only after the current analytic report is saved and if you are an administrator or a super user.
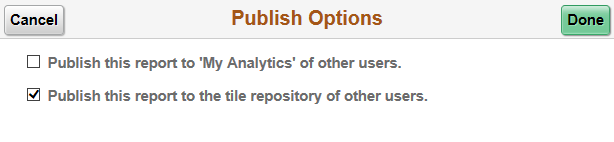
Image: Publish Options page
This example illustrates the Publish Options page. Definitions for the fields and controls appear following the example.
|
Field or Control |
Definition |
|---|---|
| Publish this report to ‘My Analytics’ of other users |
Select this option to publish the current analytic report and display it in the My Analytics section of all other users of the component. Note: The current analytic report will be available for other users only if they have access permission to the underlying query that is used with the analytic report template. Only the analytic report creators are able to edit, delete, or save the analytic reports. Other users who have shared access can use the Save As option to save a copy of the current analytic report, and then they can edit, delete, and save their copies of the analytic reports. |
| Publish this report to the tile repository of other users |
Select this option to publish the current analytic report and display it as a tile under the My Analytics folder for all users of the component, including the analytic report creator. Then these users can add the shared/published tile into their fluid landing pages using the Add Tile option from the Personalize menu. Note: To disable the Publish this report to the tile repository of other users option in the Publish Options window, deselect the When used as analytics templates, allow created reports to be accessed outside the component context option in Pivot Grid Wizard - Specify Data Model Options page - Fluid Mode Options section. See Specifying Data Model Options and Security Considerations When Using Simplified Analytics. |
| Done |
After you select the publish options, click this button once to publish the analytic report. If the analytic report is already published and you click this button again, you have the options to stop publishing the analytic report and to remove the analytic report from the tile repository. |
After the analytic reports are created, the titles of the analytic reports appear in the My Analytics section of the component as links. You can use these links to open the analytic reports in modal window. The analytic reports appear in the same layout as saved by the report creator.
Navigation
Open the component that has the Simplified Analytic feature enabled and that has published analytic reports in the My Analytics section.
Click the report link under the My Analytics section to open the analytic reports in a new window.
Image: Supplier Watch component displaying analytic report link
This example illustrates the Supplier Watch component, which displays the PO Non-Contract Spend report link under the My Analytics section.
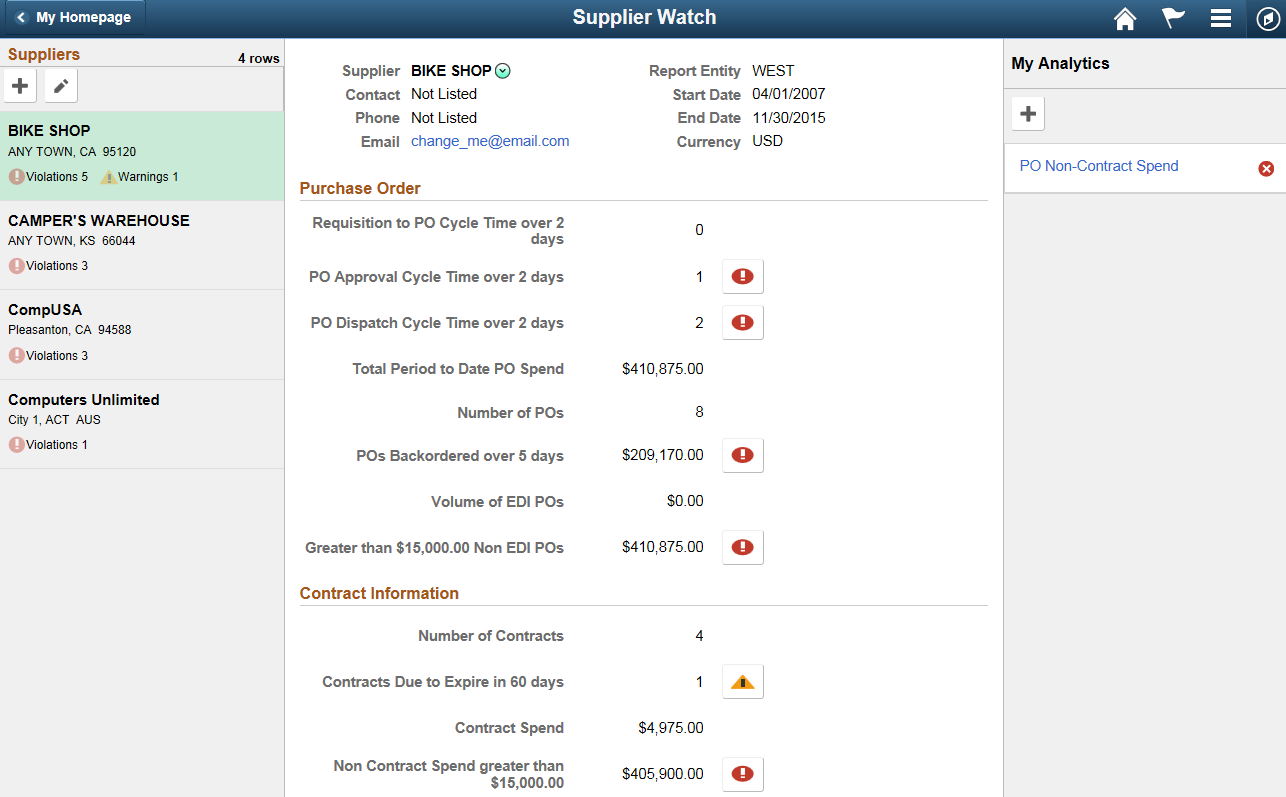
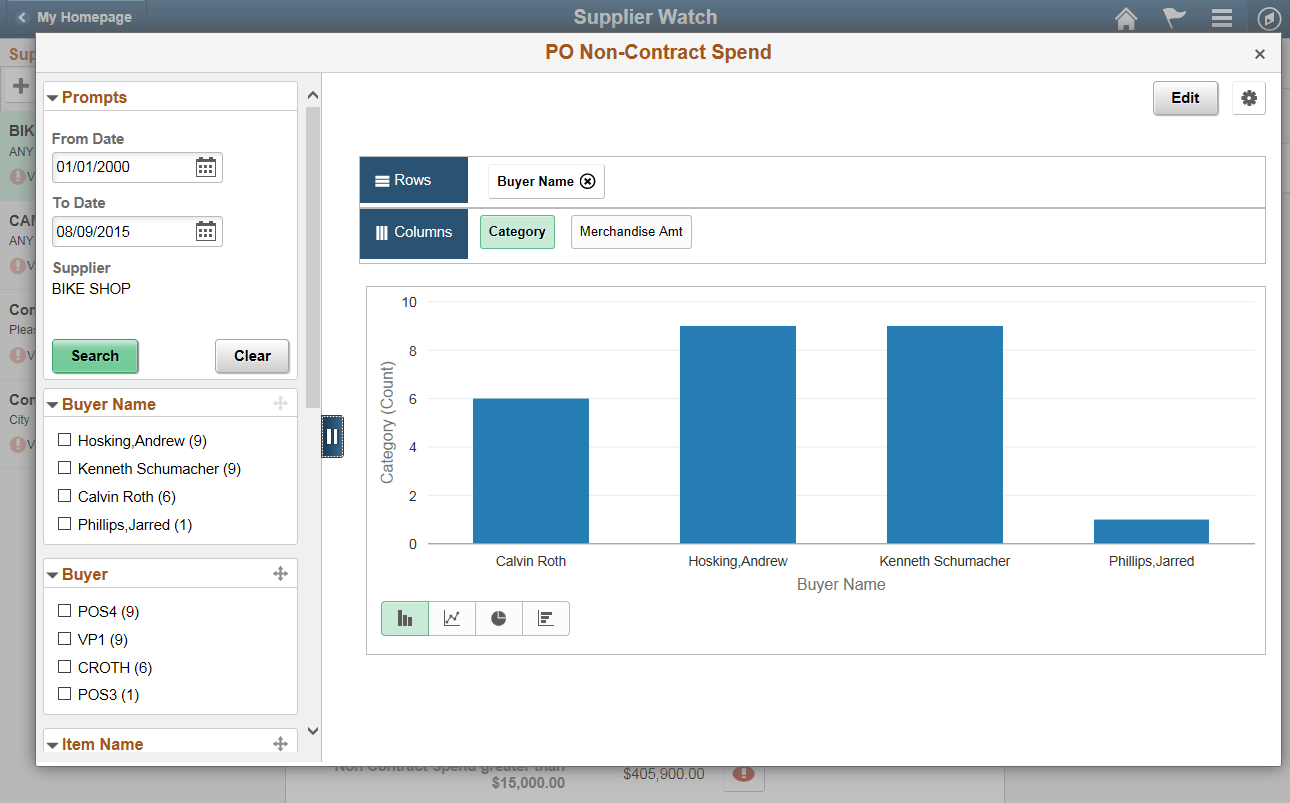
Image: PO Non-Contract Spend report
This example illustrates the PO Non-Contract Spend report after users click the PO Non-Contract Spend link from the My Analytics section. The system displays the report using the same layout saved by the report creator. The supplier prompt value is mapped from the application page and is, therefore, display only.
|
Field or Control |
Definition |
|---|---|
| Edit |
If you are the report creator, use the Edit button to access the Edit Analytics Wizard to edit the analytic report. |
| Options Menu \ Save As |
Use the Save As option from Options Menu to create a copy of the analytic report. The newly copied analytic report will be available as a link in the My Analytics section. Note: After you copy the analytic reports, you can edit the copied analytic report; for example, you can change the report type, template, fields, prompt values, layout, and so on. |
Note: If the value of the prompt in the application page changes, the analytic report results change to reflect the new value in the prompt when users reopen the analytic report. For example, if the supplier value in the application page changes from BIKE SHOP to CompUSA, then when you reopen the PO Non-Contract Spend report, the view appears using the new prompt value for the supplier CompUSA.
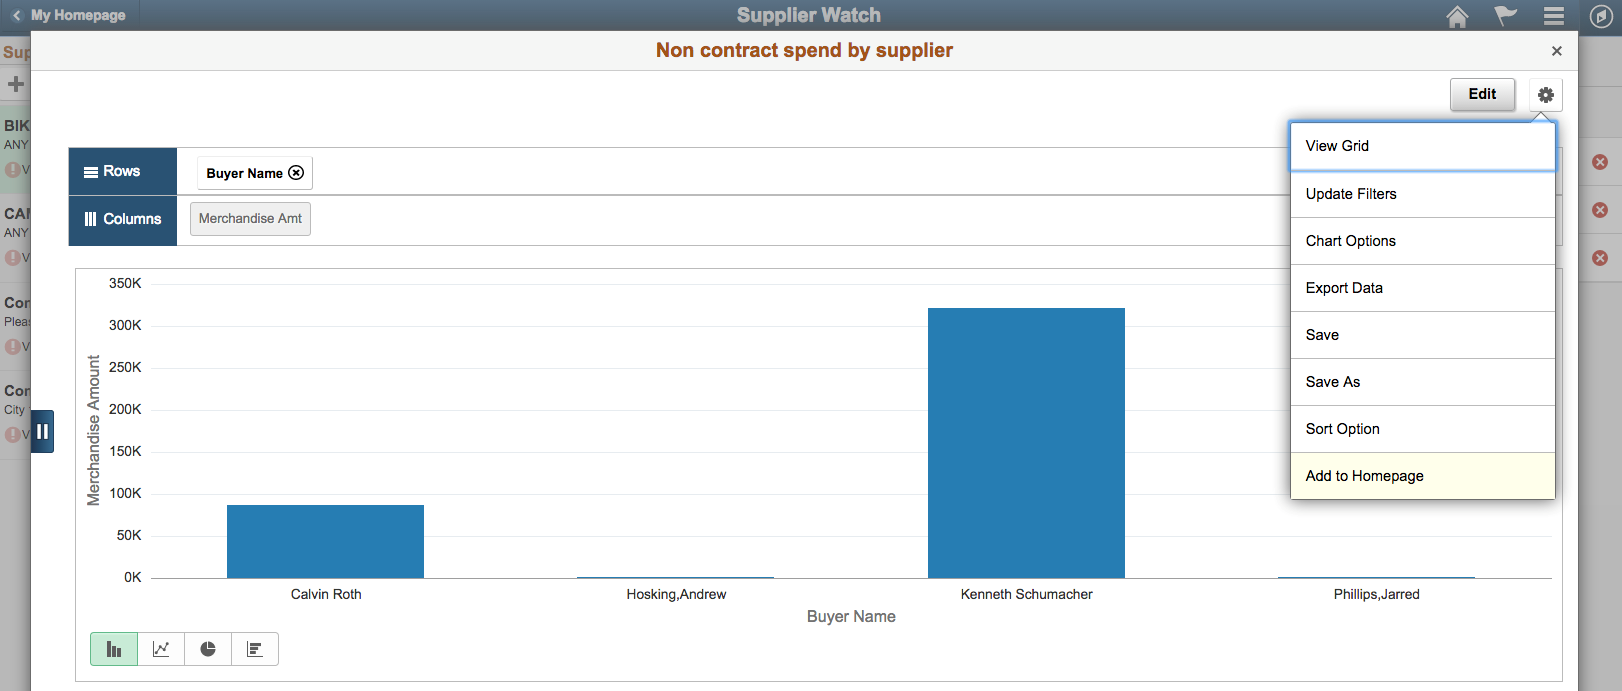
While viewing an analytics report, you can add it to the fluid homepage using the Add to Homepage option in Options Menu. All analytic reports in the fluid homepage appear in a 2x2 tile with the chart preview.
Image: Add to Homepage and other options in Options Menu
This example illustrates the Add to Homepage and other options in Options Menu.
If you are not an administrator or a super user, after you create and save the analytic report you can add the analytic report to the homepage using the Add to Homepage button in the Create Analytics Wizard - step 3 or the Edit Analytics Wizard - step 3.
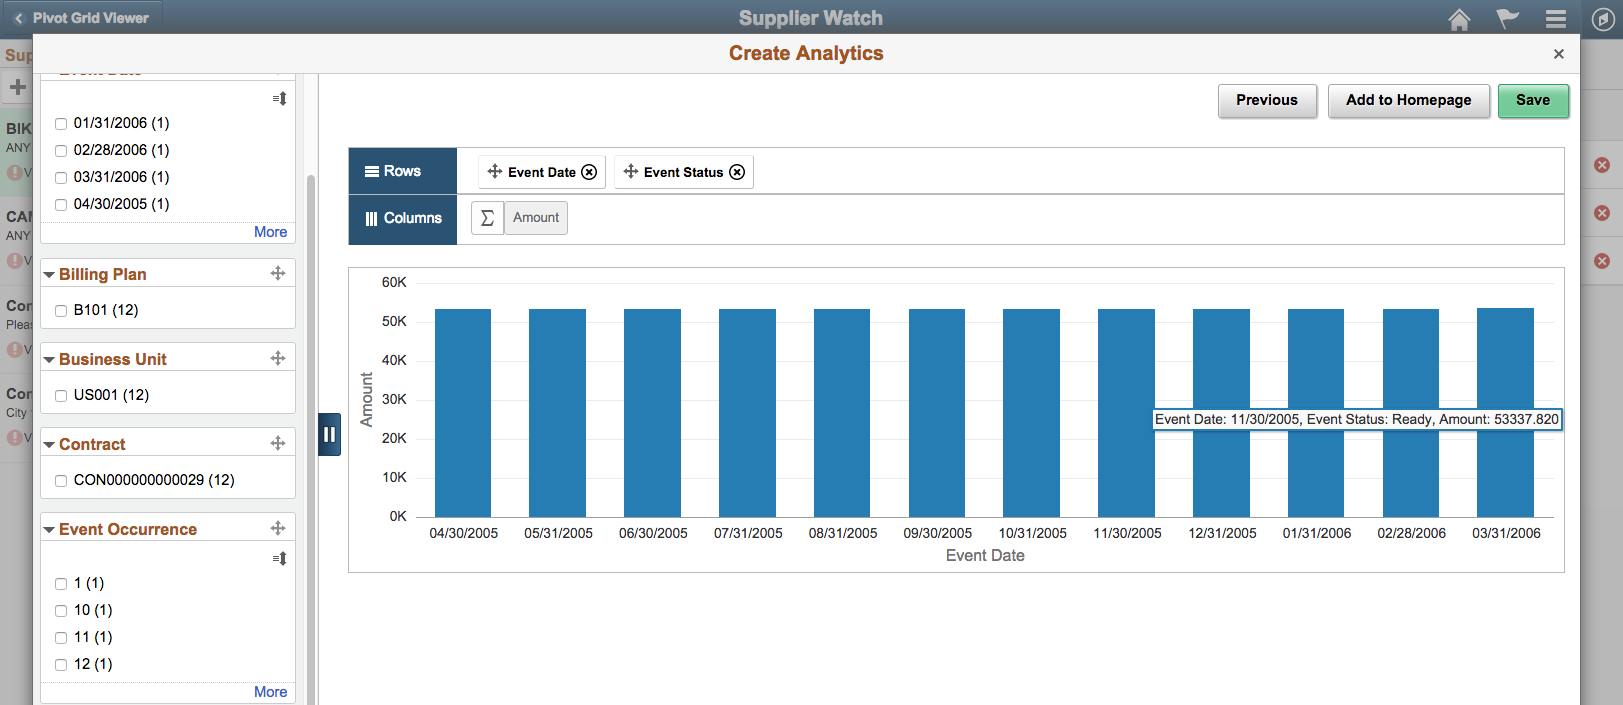
Image: Create Analytics Wizard displays the Add to Homepage button
This example illustrates the Create Analytics Wizard – step 3. The Add to Homepage button is at the top-right of the window.
Note: You can add a report once to any homepage. If the report was already added to the homepage and you attempt to add the report again, then you have the option to delete the report from the homepage and add it back to the homepage.
Image: Homepage displaying analytic report tile
This example shows the homepage displaying the Non contract spend by supplier report as a 2x2 tile with the chart preview. You can click the report tile to access the application page source from which the report was created.
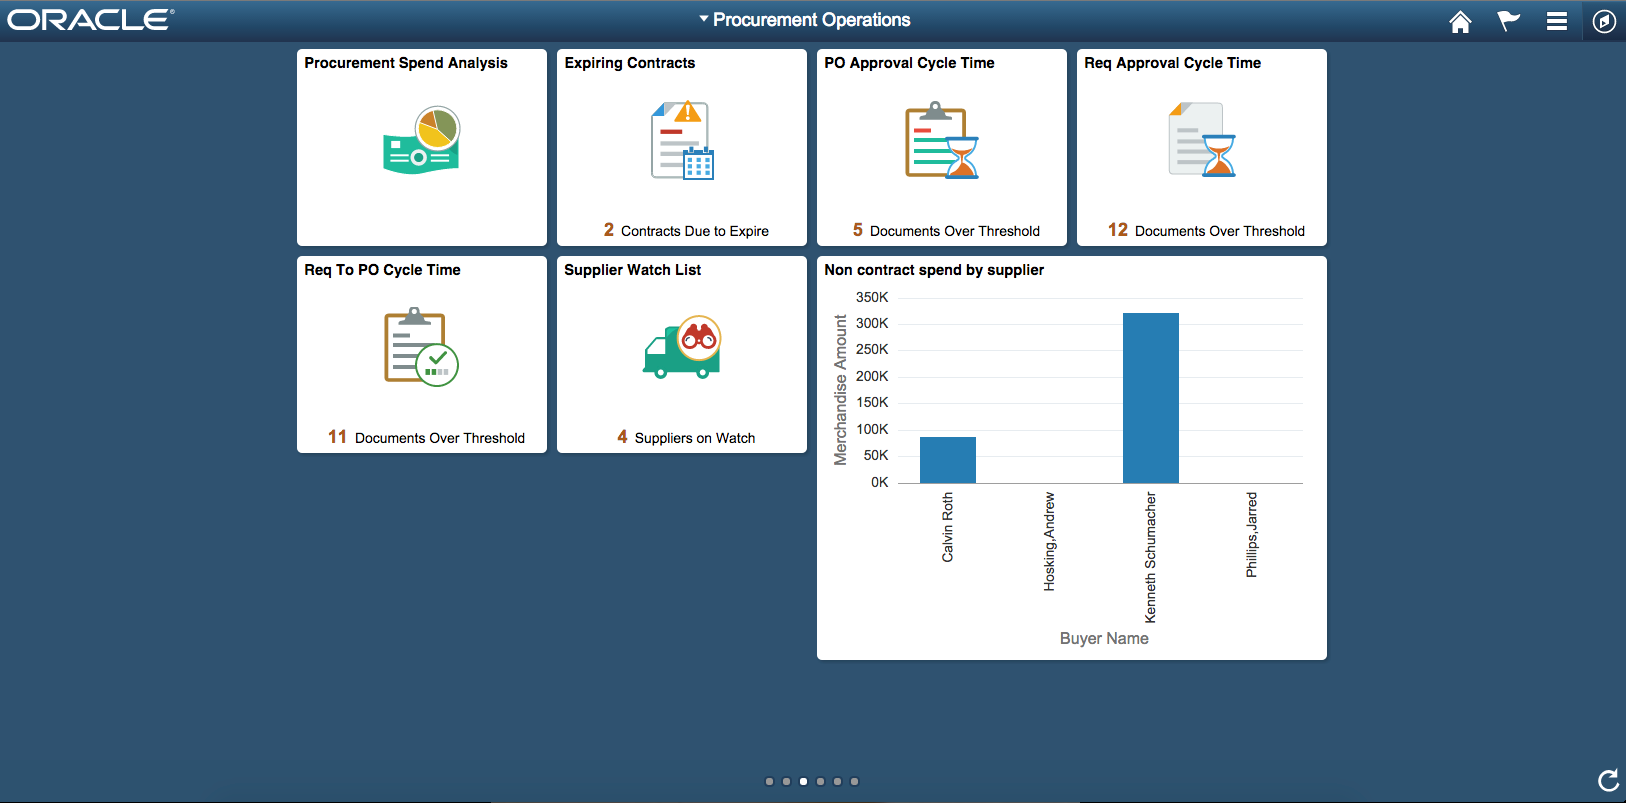
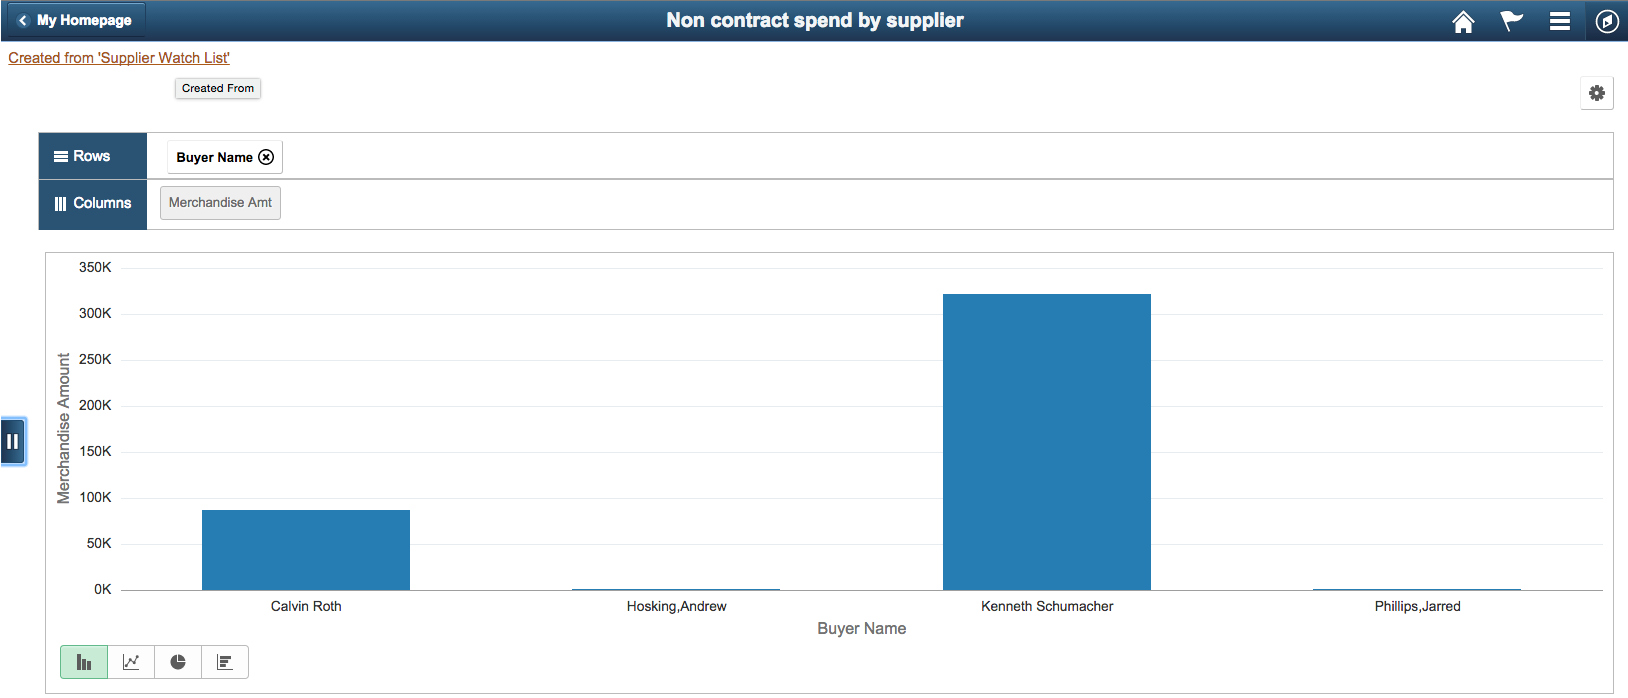
Image: Non Contract Spend by Supplier report
This example shows the Non contract spend by supplier report after you click the Non contract spend by supplier tile in the previous example. You can click the Created from ‘Supplier Watch List link at the top-left of the page to access the Supplier Watch List page from which the report was created.
Report creators use the Edit Analytics Wizard to edit analytic reports. The steps in the Edit Analytics Wizard are similar to those in the Create Analytics Wizard.
Use the Create Analytics Wizard - step 1 (PTPG_REPORT_WIZ_1) to specify the names of the analytic reports, select the analytic report templates, and display options that will be used to create the analytic reports.
Use the Create Analytics Wizard - step 2 (PTPG_REPORT_WIZ_2) to select the fields for the analytic reports.
Use the Create Analytics Wizard - step 3 (PTPG_REPORT_WIZ_3) to preview the analytic reports based on the display options, fields, and prompts selected in the previous steps of the wizard. Optionally, use this page to modify the analytic reports to finalize the design and then to save the final settings of the analytic reports or publish the analytic reports as the analytic report templates to other end users.
Navigation
Click the Edit button from the opened analytic reports.
Image: Edit Analytics Wizard - Step 1
This example illustrates the fields and controls on the Edit Analytics Wizard - step 1.
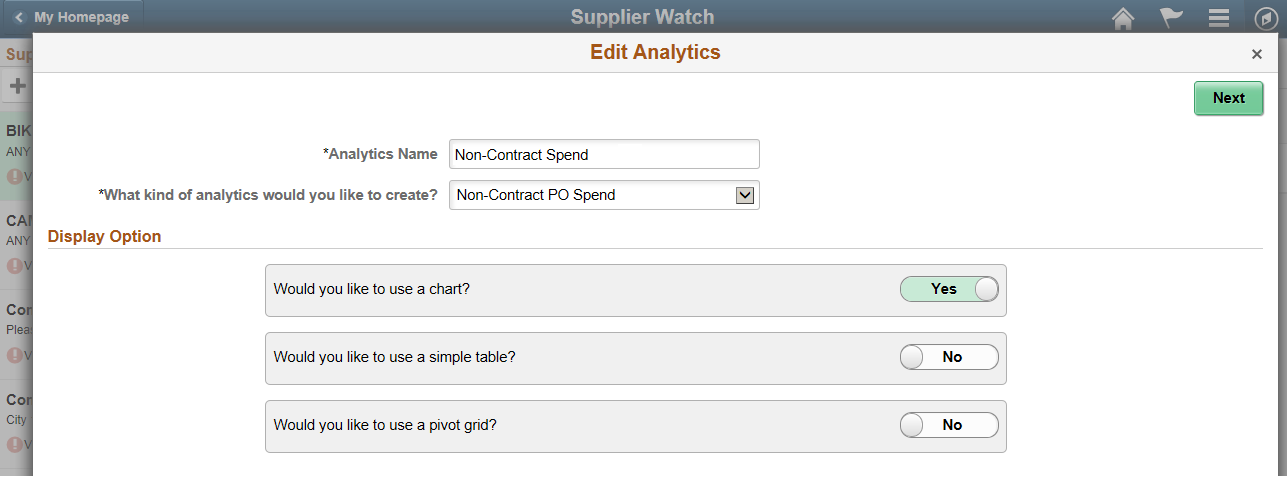
Image: Edit Analytics Wizard - Step 2
This example illustrates the fields and controls on the Edit Analytics Wizard - step 2.
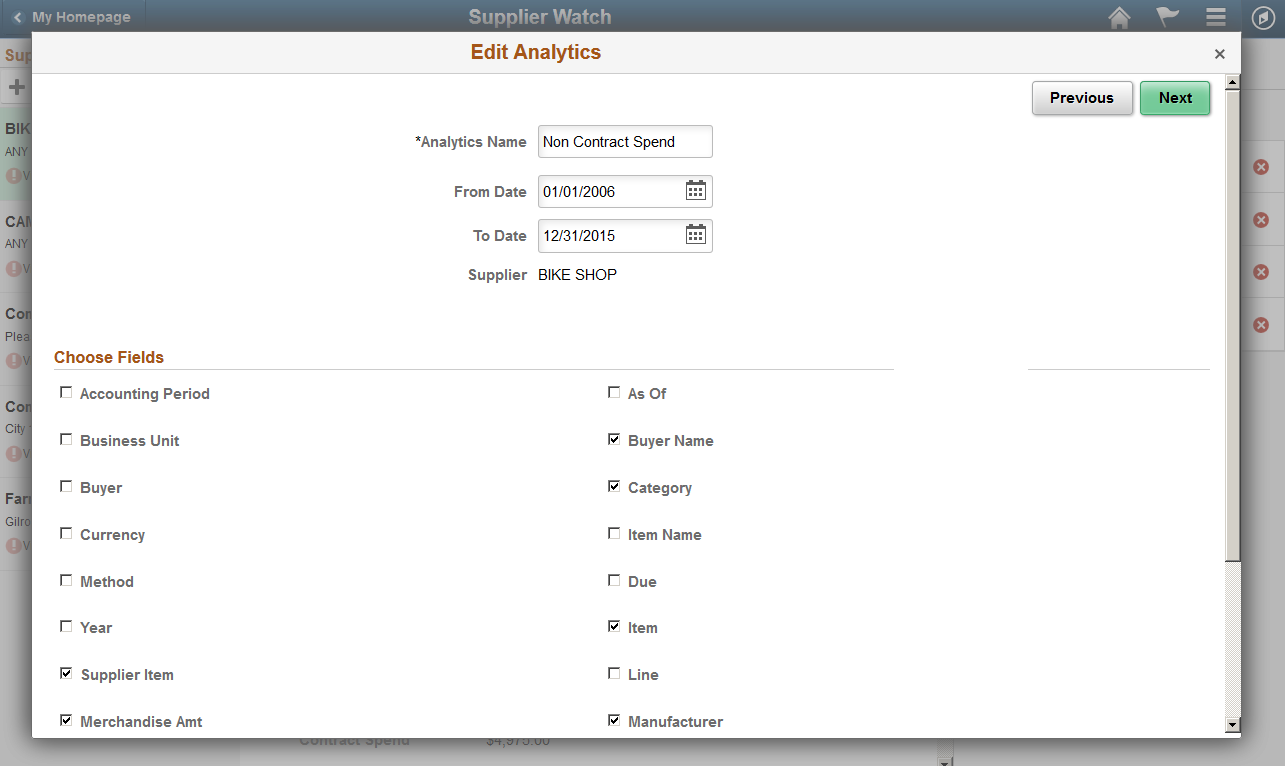
Image: Edit Analytics Wizard - Step 3
This example illustrates the Edit Analytics Wizard - step 3 - preview window.
Oracle PeopleSoft delivers the (My)Analytic Reports component that can be registered as a tile by applications. This component enables end users to view and access a list of all analytic reports they have created in the database:
Menu: PTPG_WIZ_MENU
Component: PTPG_ANARPT_LST
Market: GBL
URL:
http://site:port/psc/<sitename>/<portalregistryname>/<nodename>/c/PTPG_WIZ_MENU.PTPG_ANARPT_LST.GBL
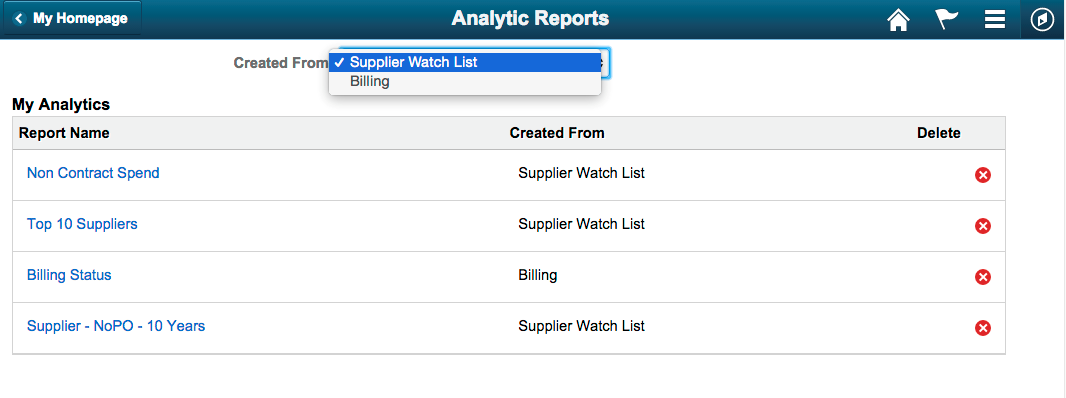
Image: Analytics Reports page
This example illustrates the Analytics Reports page. Definitions for the fields and controls appear following the example.
|
Field or Control |
Definition |
|---|---|
| Created From |
Use this drop-down list to filter the reports that were created from a specific application component. |
| My Analytics |
This section lists the analytic reports that current users have created in the database. |
| Report Name |
Click the report name link to open the report in modal window. |
| Created From |
This column displays the components from which the analytic report was created. |
| Delete |
Click this icon to delete the corresponding analytic report from the database. |
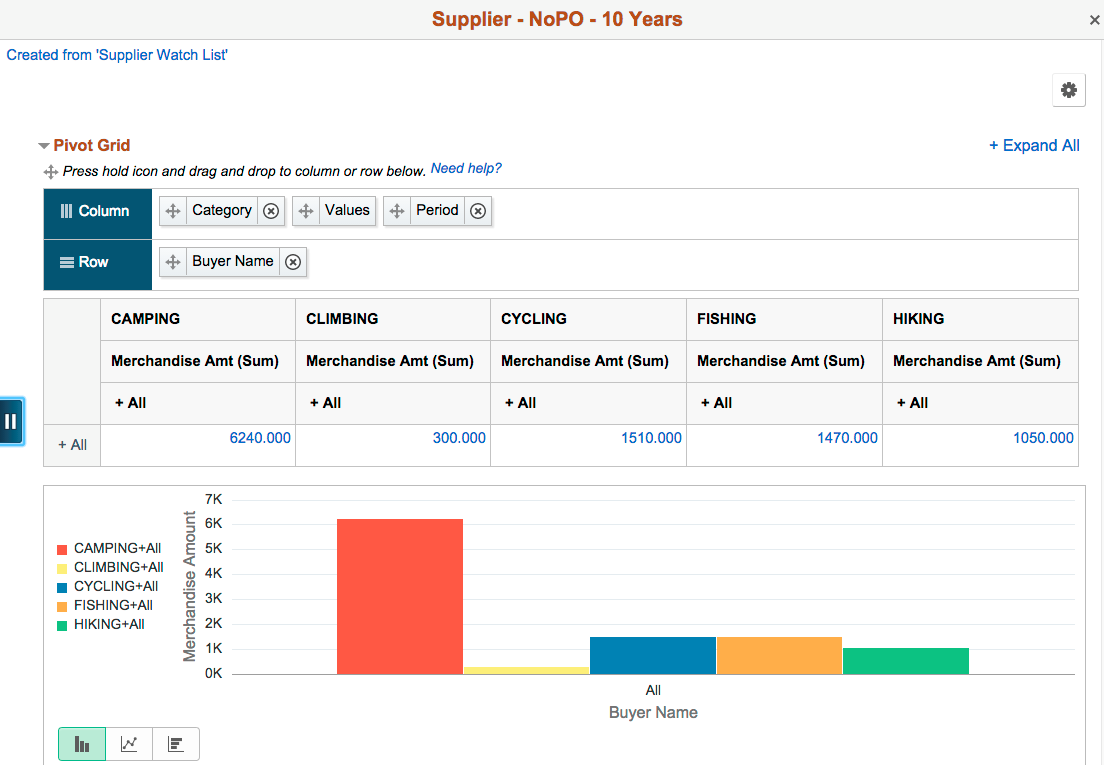
Image: Supplier - NoPO - 10 Years analytic report
This example illustrates the Supplier - NoPO - 10 Years analytic report after you click its name link in the My Analytics section. The Supplier - PO - 10 Years analytic report was created from Supplier Watch List. Clicking the Created From Supplier Watch List link opens the Supplier Watch List component.