Performing Actions on the Chart View on the Fluid Mode
The chart view is available as part of the Pivot Grid models that have the default view set to Chart Only or Pivot Grid and Chart. The chart view appears in the right panel of the viewer. The chart can include series, overlay, and legends. The charts in fluid mode are able to resize based on the view port.
Similar to classic Pivot Grid Viewer, the chart options in the menu control the various chart parameters. You can also use the Bar, Line, Pie, and Horizontal Bar icons on the face of the viewer to change the chart display.
In a Chart Only view, clicking the chart data point enables you to drill down to the Detail View, drill to available dimensions, and perform aggregate-related actions when available. After you perform drill-downs on the dimensions, the Previous button appears, enabling you to drill out to the initial view. These actions are similar to the ones in the classic Pivot Grid Viewer. When you click the Detailed View option, the selected data point is highlighted and the detail results grid and list view are shown based on the selected data point. When you click outside the data points within the chart area, the Detail View returns to the original state, and the highlight on the data point is removed.
If the Pivot Grid model view is set to Chart Only, selecting the chart data point populates the menu that includes these options:
Detailed View
Selecting the Detailed View option displays the data that corresponds to the selected chart data point.
Drilldown To
Selecting the Drilldown To option displays all available dimensions for the current chart data point. Note that when you drill down to a dimension, you set that dimension as the new X-axis on the chart and the existing X-axis value is added as a facet.
Actions (for example, Aggregate Related Actions, if configured)
Selecting the Actions option displays the aggregate related action menu.
Note: If there are no dimensions to drill down to and if there are no aggregate related actions, then selecting a data point will not display the Actions menu but will display the detail view corresponding to the data point selected.
These options are similar to the ones in the classic Pivot Grid Viewer.
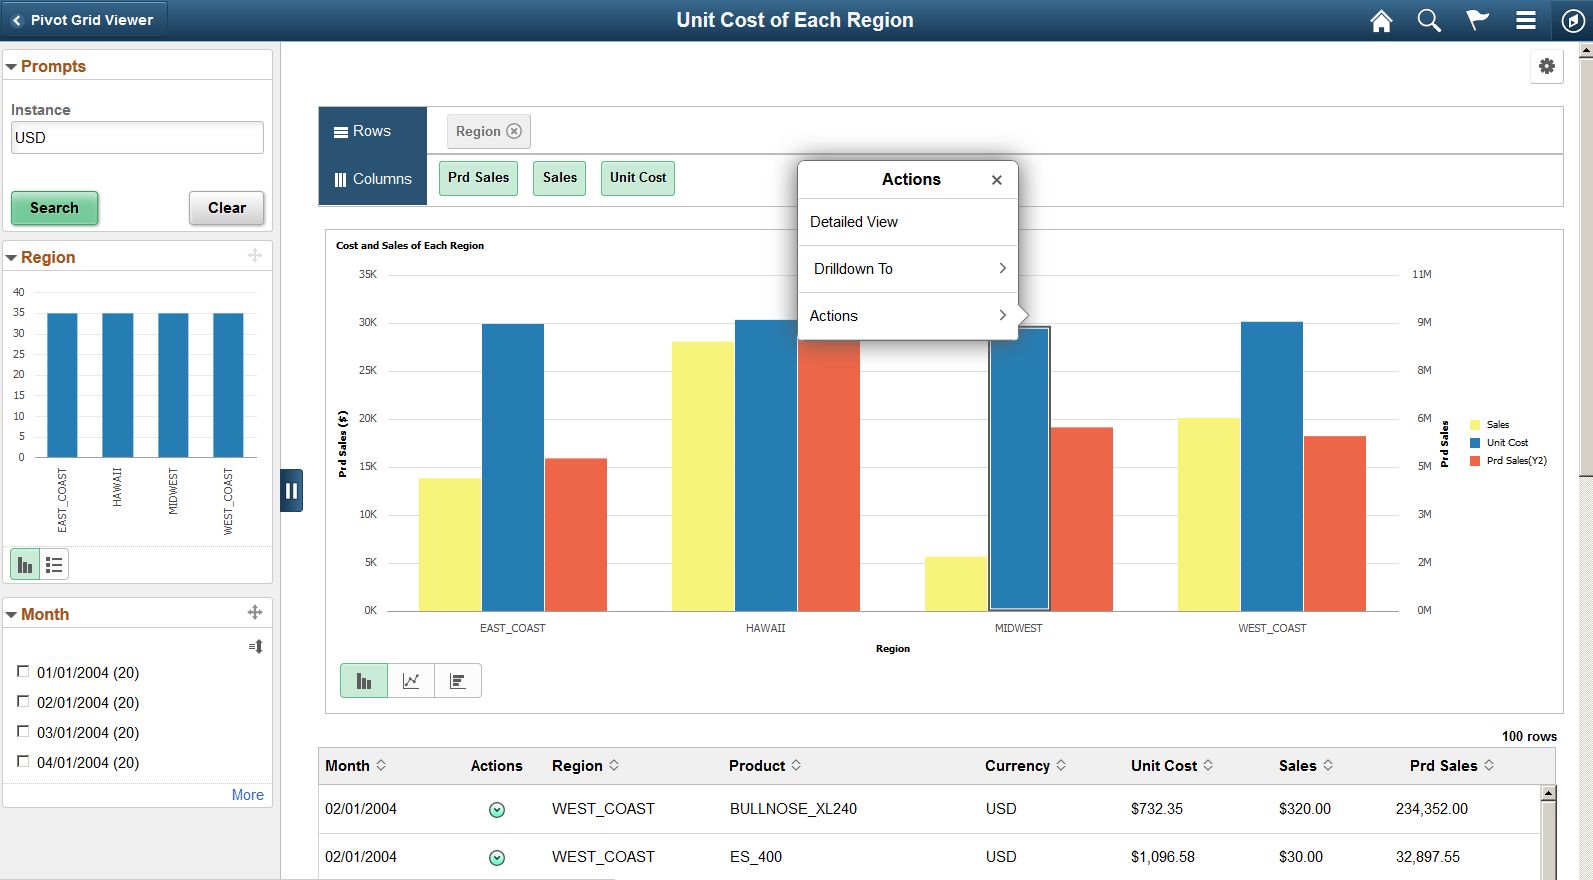
Image: Chart menu after clicking a chart data point
This example shows the chart menu after clicking the chart data point Unit Cost/MIDWEST on a Pivot Grid model that has the related action configured. The Region facet is set as a bar-chart facet. Sales, Unit Costs, and Prd Sales columns are set as Y-axes. Prd Sales column is also set as a dual Y axis.

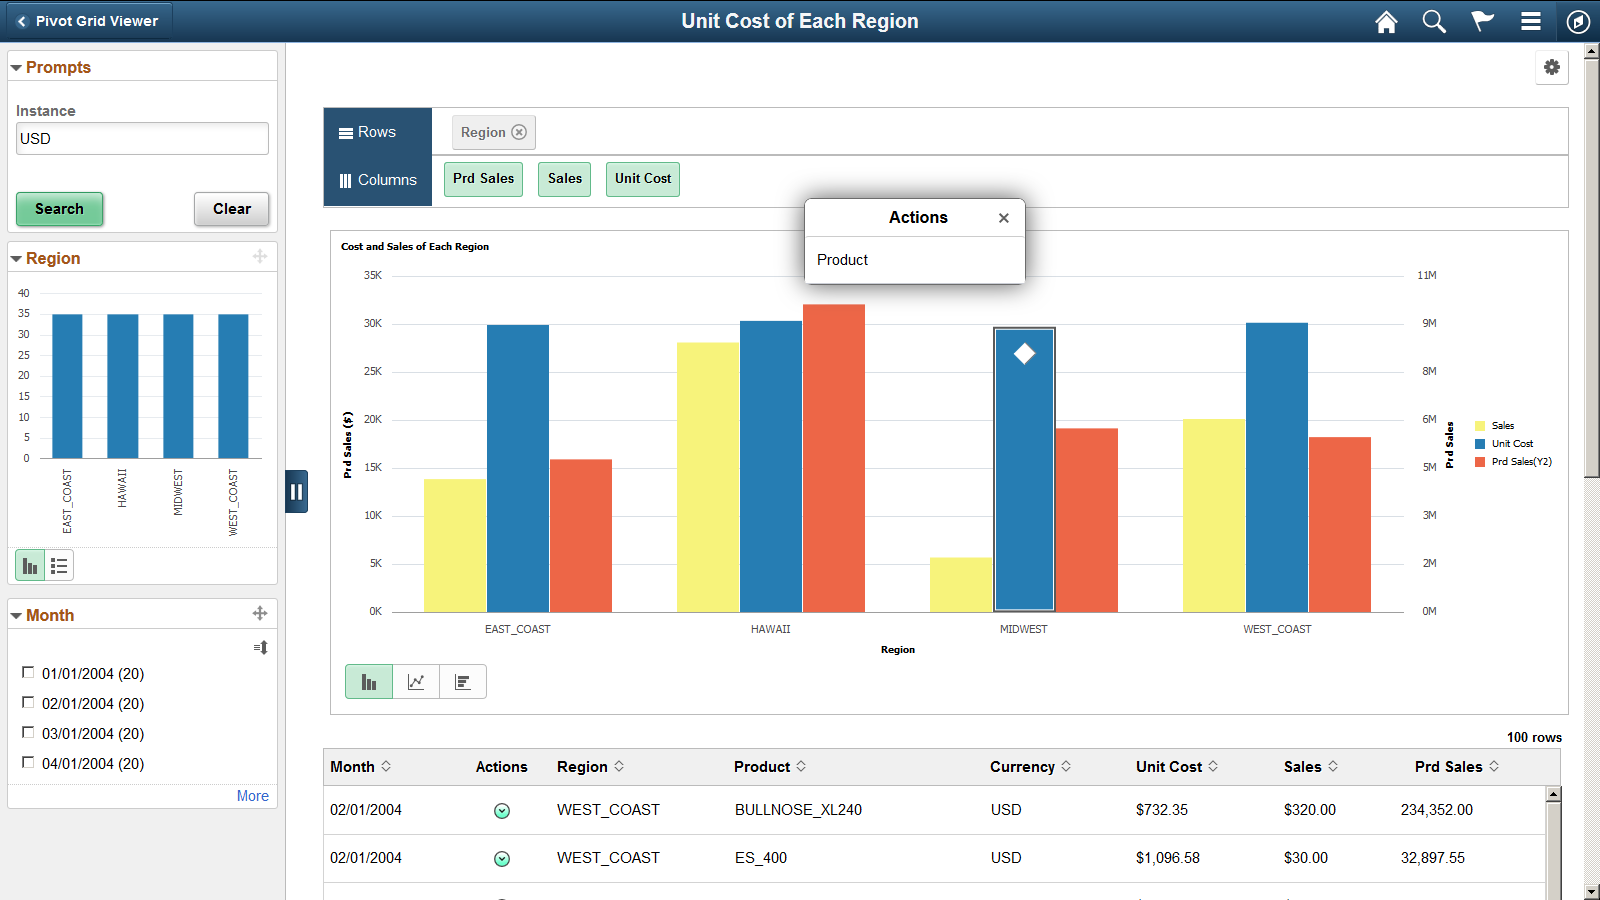
Image: Drilldown To menu listing available dimensions
This example shows the Drilldown To menu that lists the dimension(s) on which a drilldown can be performed. Note that Region is X axis, Sales and Unit Cost are Y axes, and Prd Sales is dual Y axis.

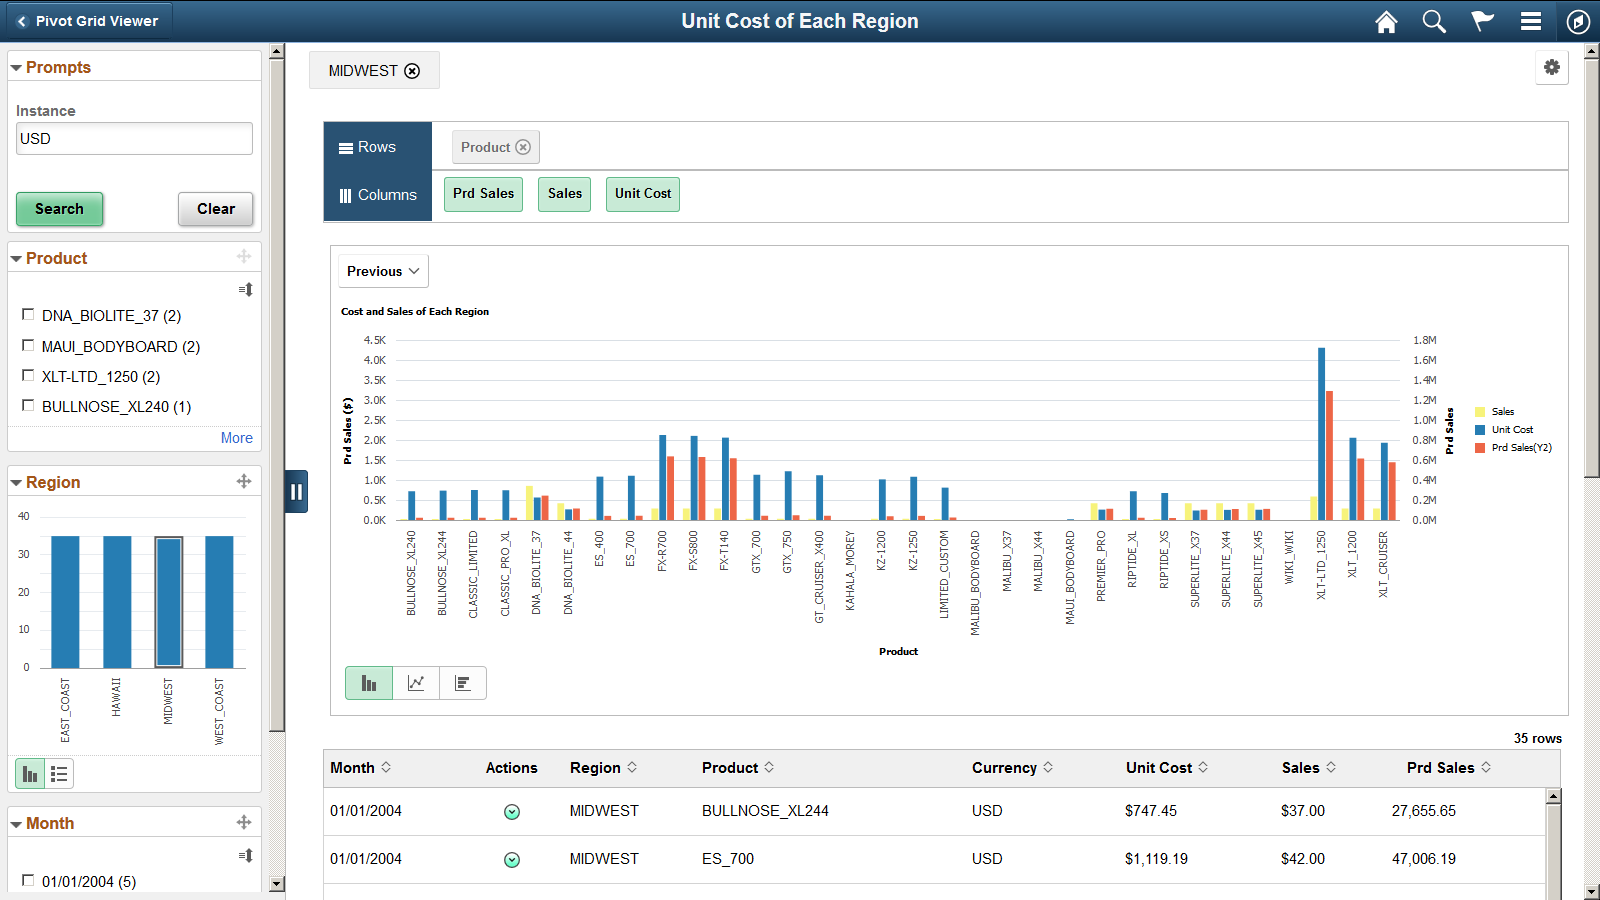
Image: Pivot Grid model after it is drilled down to Product
This example shows the Pivot Grid model after it is drilled down to Product, which is the new X axis on the chart. Product is also added to the facet area and the MIDWEST bar in the mini chart facet Region is highlighted. When you click the locator button (Previous) at the top left of the chart, a list of the previous dimensions appears enabling you to drill out to the previous selection.

You are able to drag-and-drop for the chart-only view in fluid viewer. You can drag dimensions from facet area and drop to rows to change the X-axes and series. The Column section in fluid viewer lists all the facts for the Pivot Grid model and you can select these facts to change the Y-axis for the chart.
However, row and facet dimension cannot be dropped to columns; this means that you cannot add a new fact in the pivot grid viewer.
Note: In Create Analytics Wizard – step 3, you can add or remove facts by dragging and dropping fields from the facet or the Rows areas to the Columns area or changing the aggregate value. These operations are not available in the classic Pivot Grid Viewer.
To change the axes of the chart on smart phones, you cannot drag and drop fields but you can use the Chart Options from the Options menu.