Performing Actions on the Detail Grid and List View on the Fluid Mode
Pivot Grid displays the Detail View differently for Chart Only models and Pivot Grid and Chart models.
On a Chart Only model, the Detail View appears below the chart on the fluid viewer. You can use the Grid and List icons at the top left of the Detail View to switch between the grid and the list views.
Image: Grid Detail View on fluid viewer
This example shows the Chart Only model displaying the Grid Detail View below the chart on the fluid viewer.
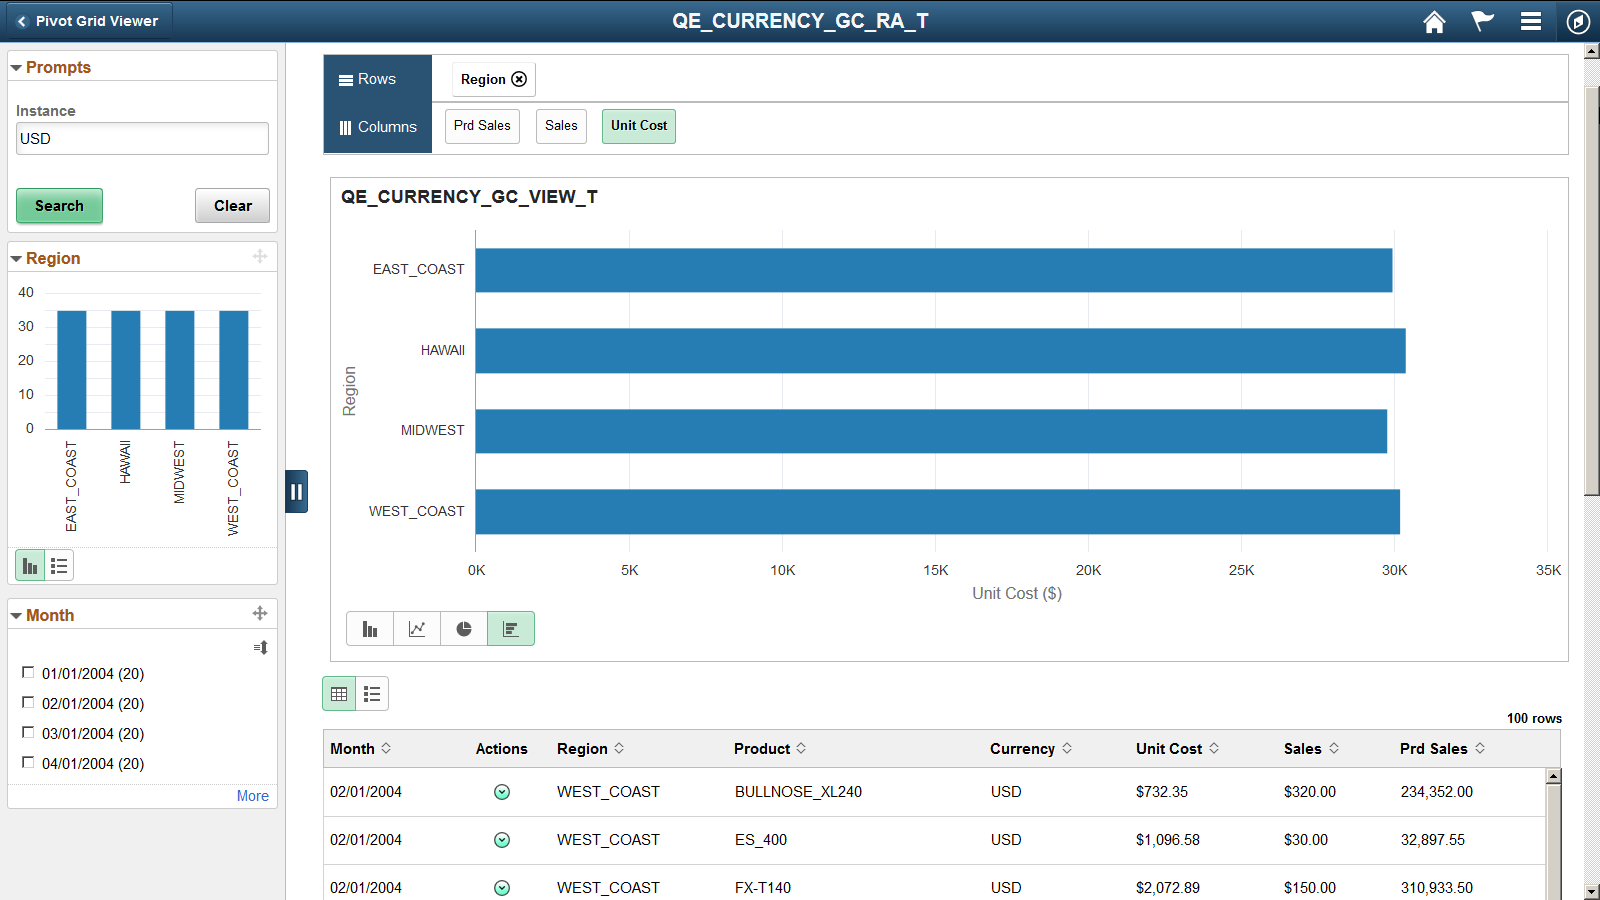
Image: List Detail View on fluid viewer
This example shows the Chart Only model displaying the List Detail View below the chart on the fluid viewer.
When you click a data point in the chart and select the Detailed View option, the selected data point is highlighted and the Detail View below the chart is filtered. When you click outside the data point but within the chart area, the highlight on the data point is removed and the Detail View is reset to its original state.
Note that when there are no dimensions to drill or when there is no aggregate related action, selecting a data point filters the detail view without showing any popup menu.
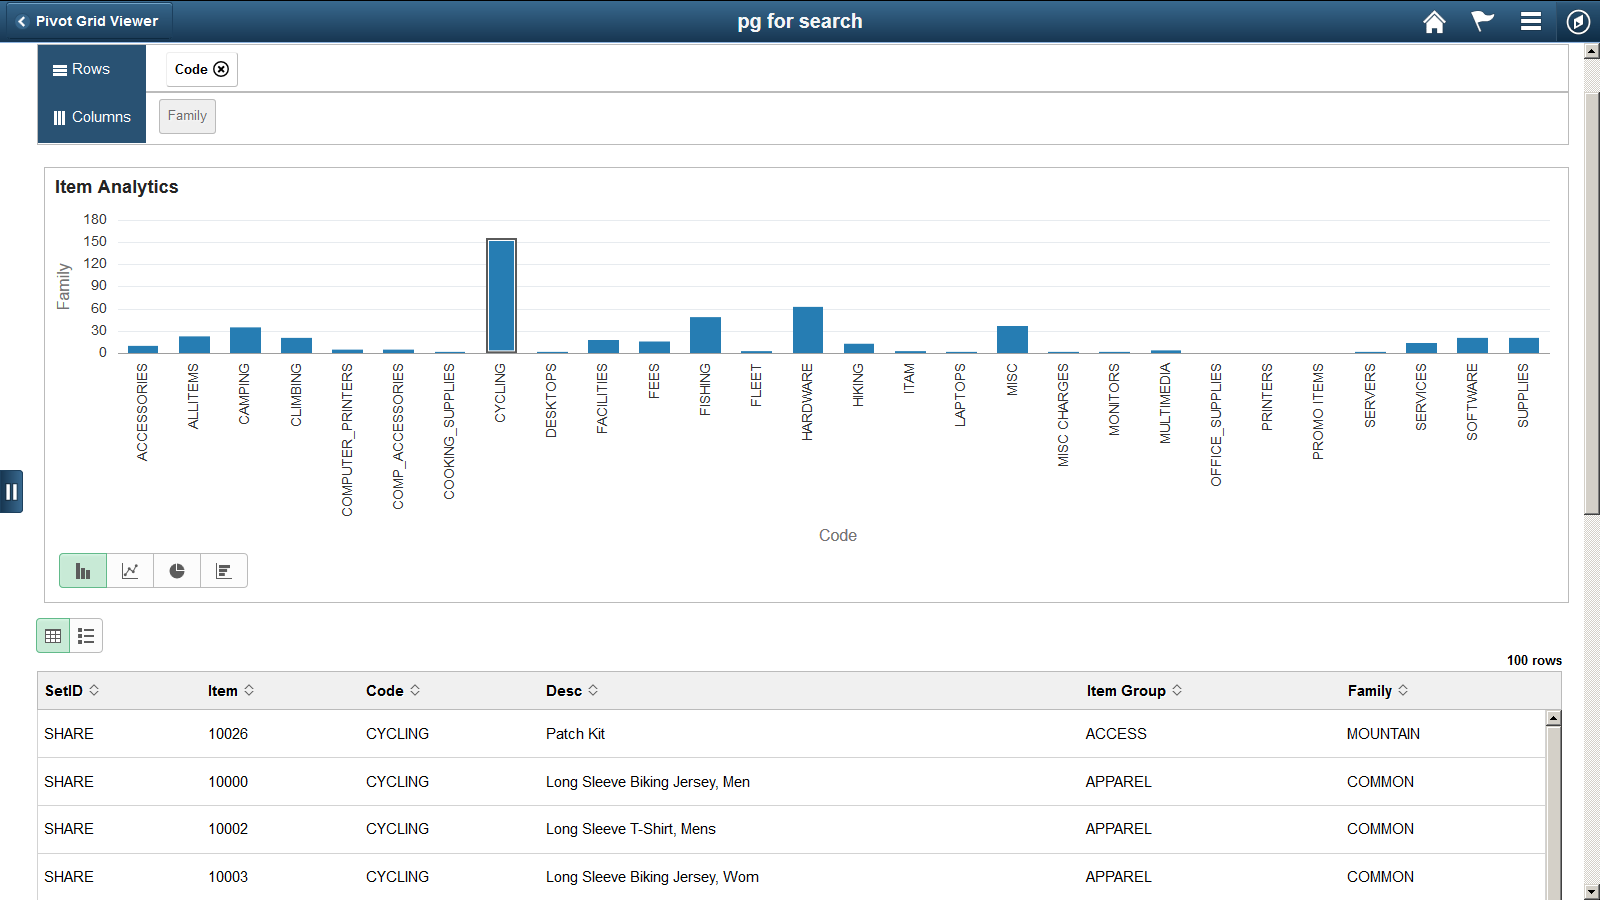
Image: Actions on the data point CYCLING
In this example, the data point CYCLING in the chart is selected and its Action list includes the Detail View option.
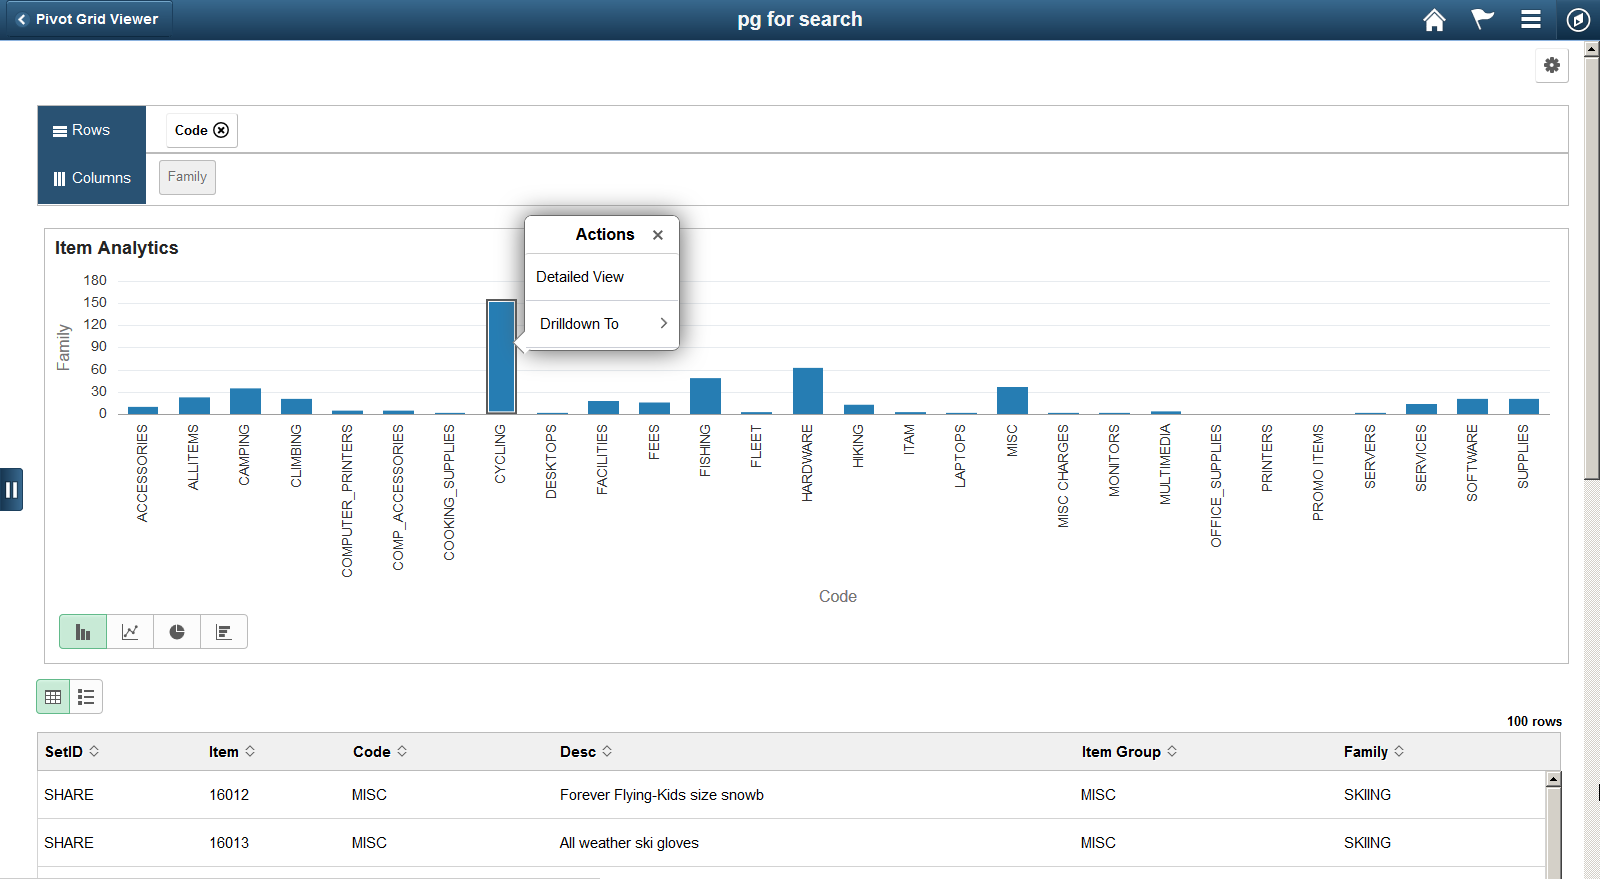
Image: Detail View is filtered to CYCLING
In this example, after clicking the Detailed View option on the data point CYCLING, the data point CYCLING in the chart is still highlighted and the Detail View below the chart is filtered to the code CYCLING.
On a Pivot Grid and Chart model, the Detail View does not appear on the face of the fluid viewer. You can click the data point in the grid or in the chart to display the Detail View in a modal. If aggregate action is configured, a menu appears enabling you to select an aggregate action or open the Detail View.
Image: Grid and chart view of a Pivot Grid and Chart model
This example shows the grid and chart view for a Pivot Grid and Chart model. The WEST_COAST bar on the Region filter is selected and highlighted.
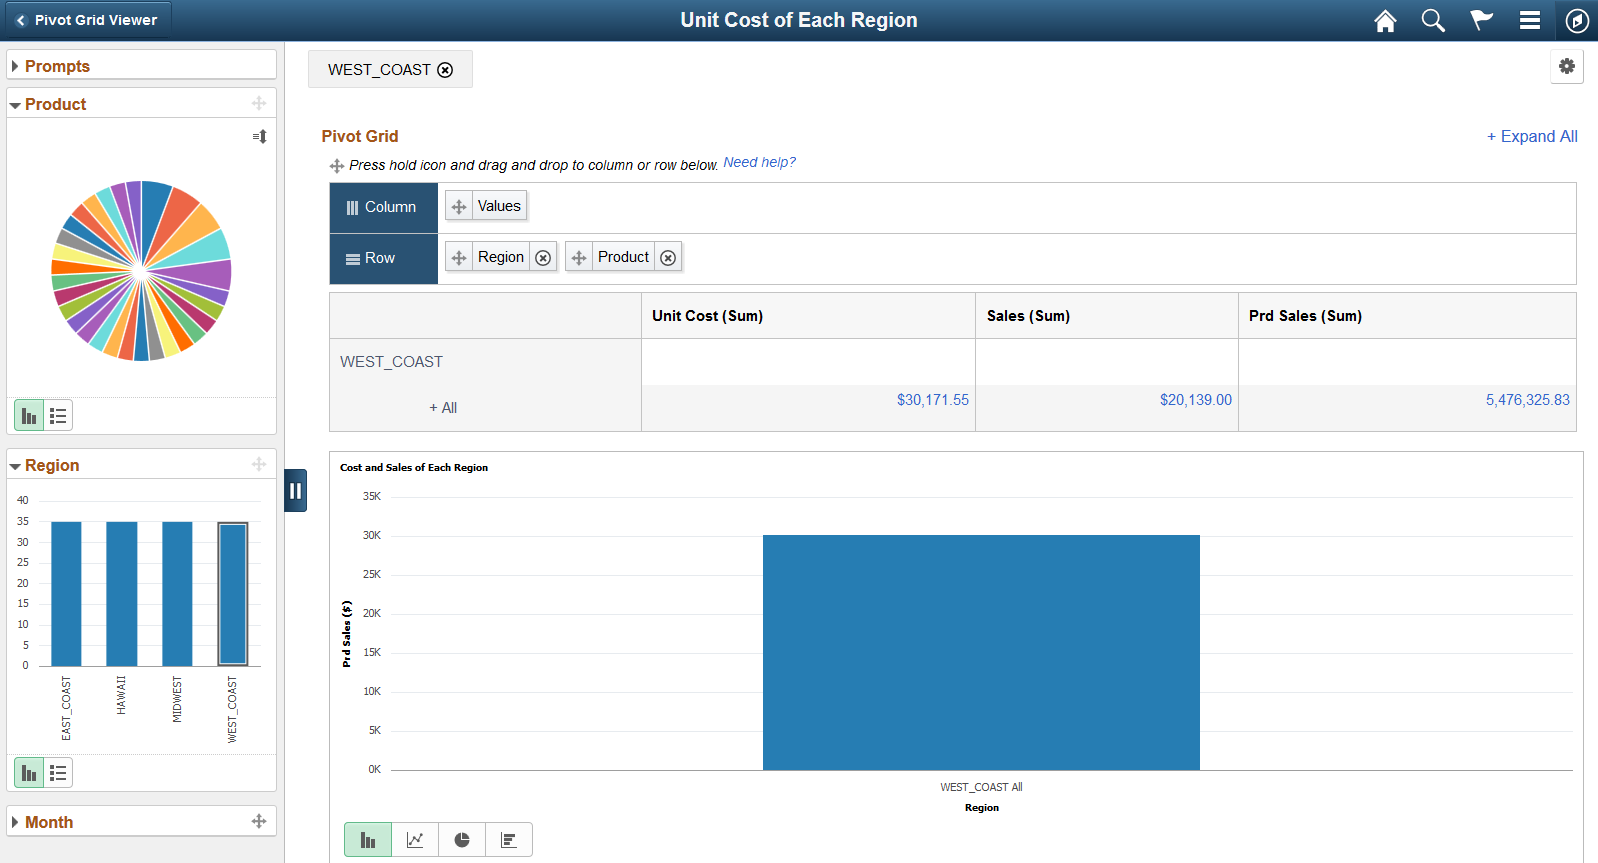
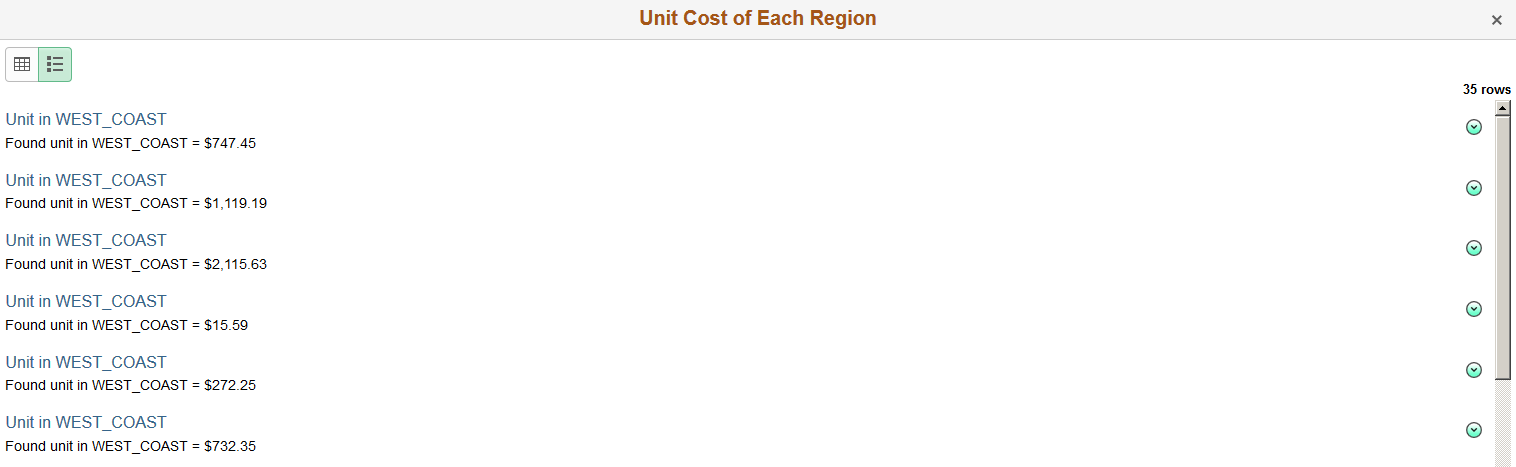
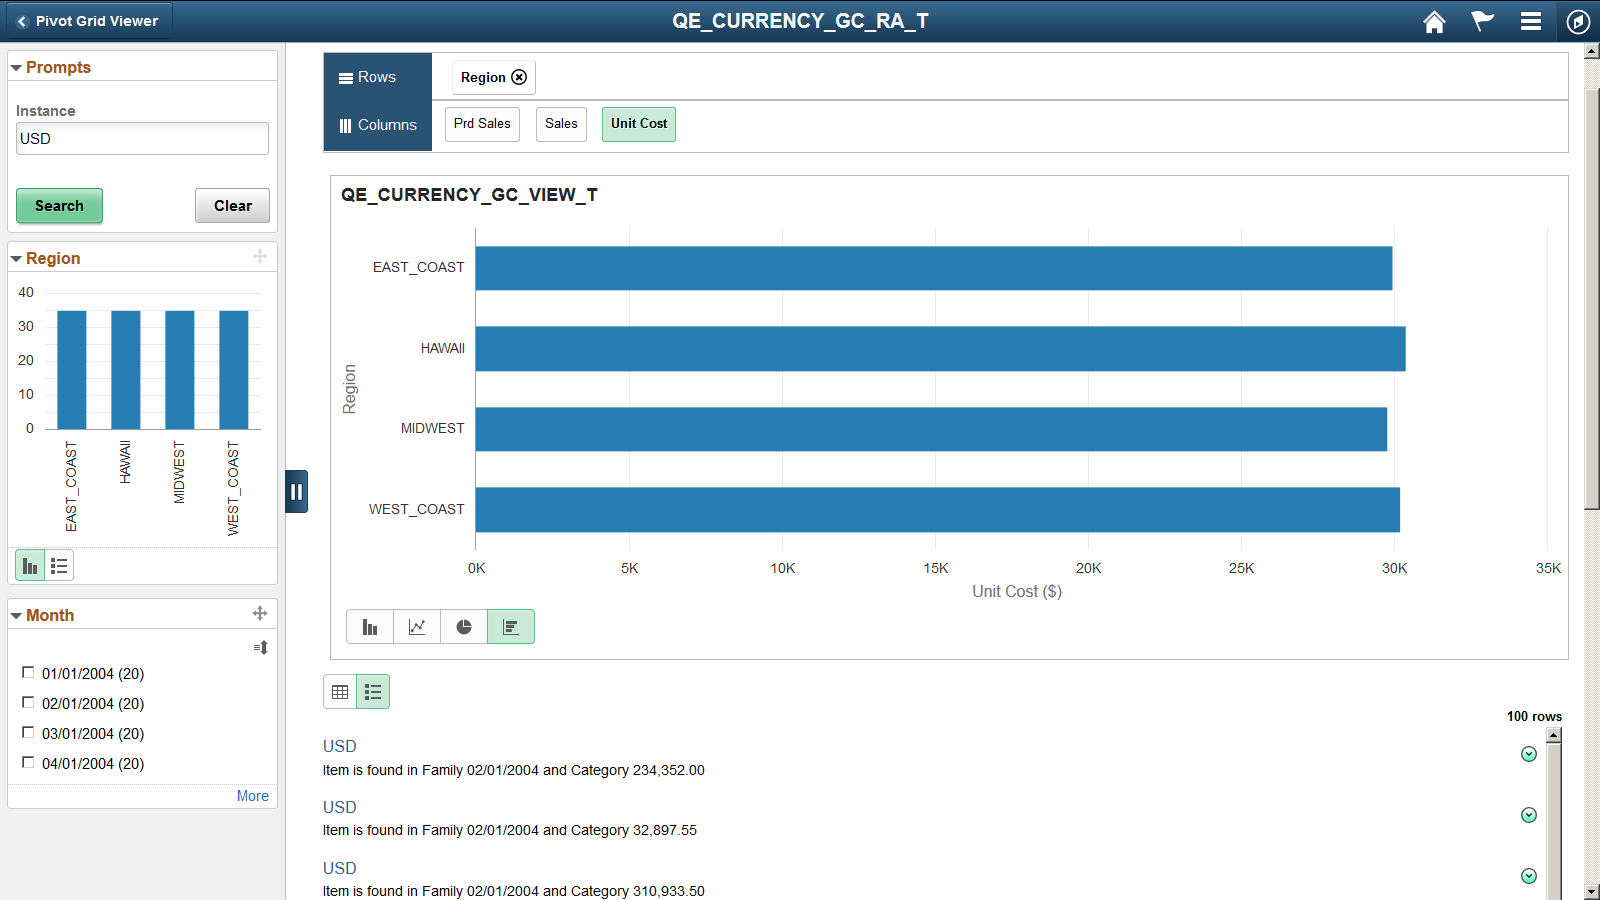
Image: Grid view filtered by WEST_COAST
This example shows the Grid Detail View in a modal after you select the WEST_COAST bar on the Region filter and click a chart data point to view the detail view. When the row-level related action is configured, related action icons appear in the second column in the Grid Detail View.
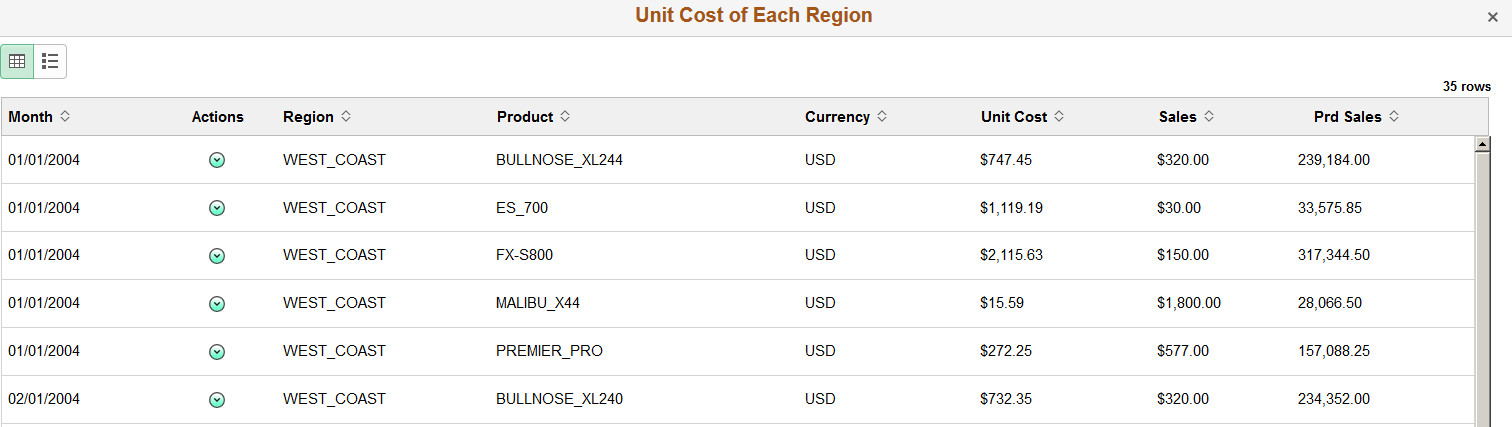
Image: List view filtered by WEST_COAST
This example shows the List Detail View in a modal after you select the List toggle icon at the top left of the Grid Detail View. When the row-level related action is configured, related action icons appear at the right of the Detail View.