Performing Actions on the Pivot Grid View on the Fluid Mode
When the Pivot Grid models have the default view set to Pivot Grid Only, select the Open in Fluid Mode option in the Pivot Grid Viewer search page to view these models in the fluid view.
To view the model in the fluid view:
Access the Pivot Grid Viewer search page by selecting Reporting Tools, Pivot Grid, Pivot Grid Viewer.
Select the Open in Fluid Mode option for the model that you want to view.
Click the Pivot Grid name link.
Note: You can also use home page tiles (or grouplets) or related actions to view a Pivot Grid model in fluid mode.
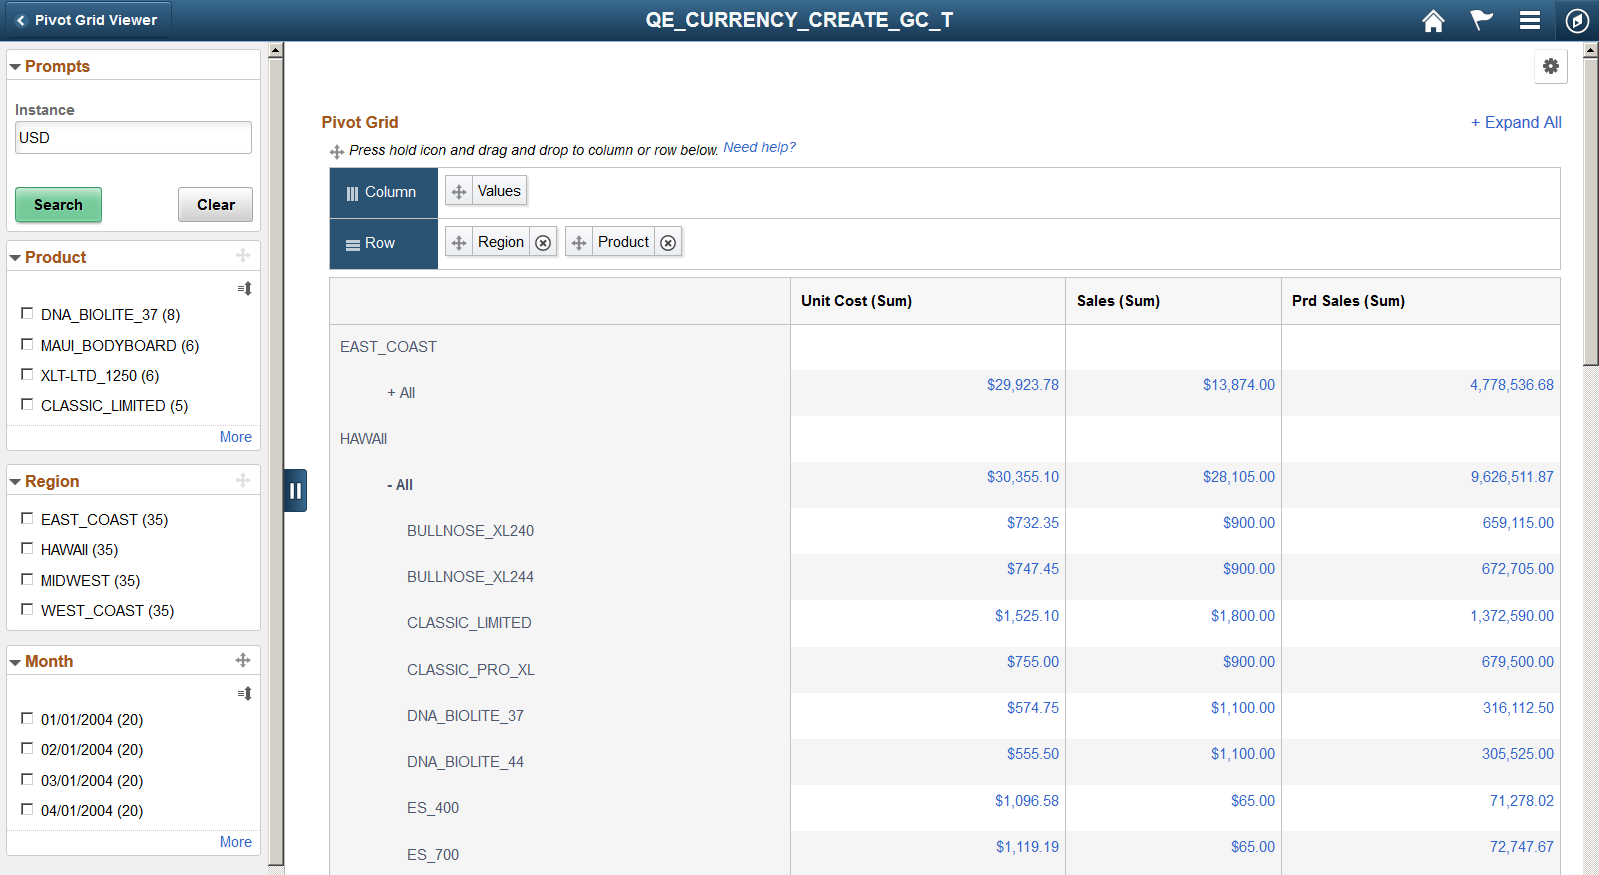
Image: Pivot Grid Only model in the fluid view
This example illustrates a Pivot Grid Only model in the fluid view.
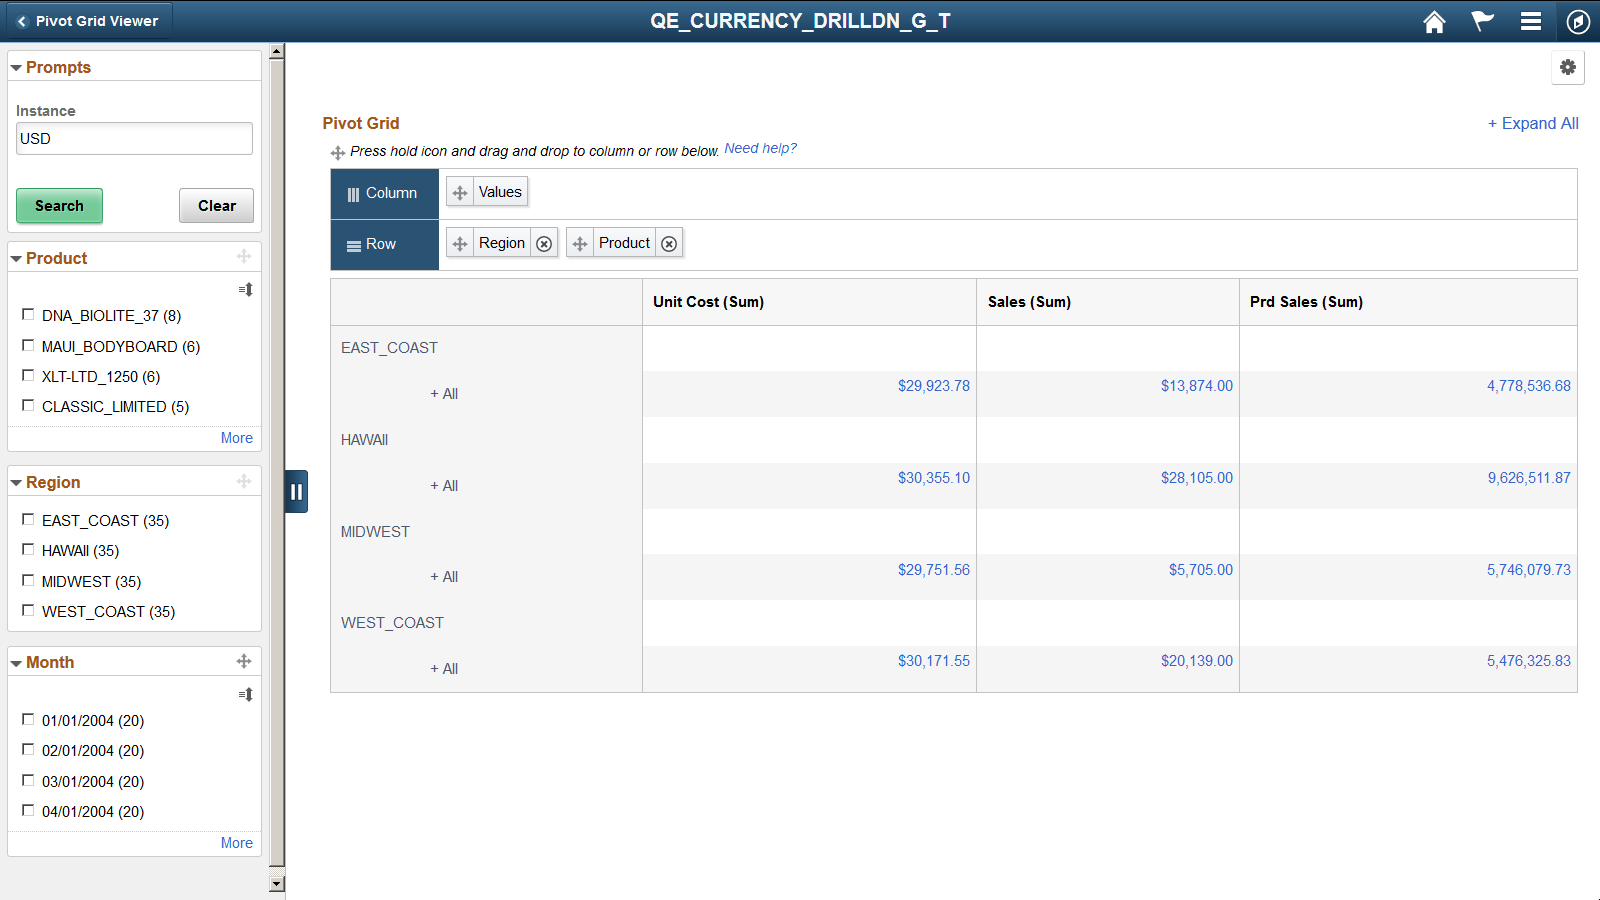
When the number of columns in the grid is less than the width of the view port, the grid expands to fill the space. However, when the number of columns is more than can be accommodated in the view port, a horizontal scrollbar is available for you to scroll among columns.
You can click the Need Help link in the grid region to view the help message for the drag-and-drop function.
Image: Need Help window
This example illustrates the Need Help window when you click the Need help? link. Use the Need Help window to view how to drag filter to row or column.
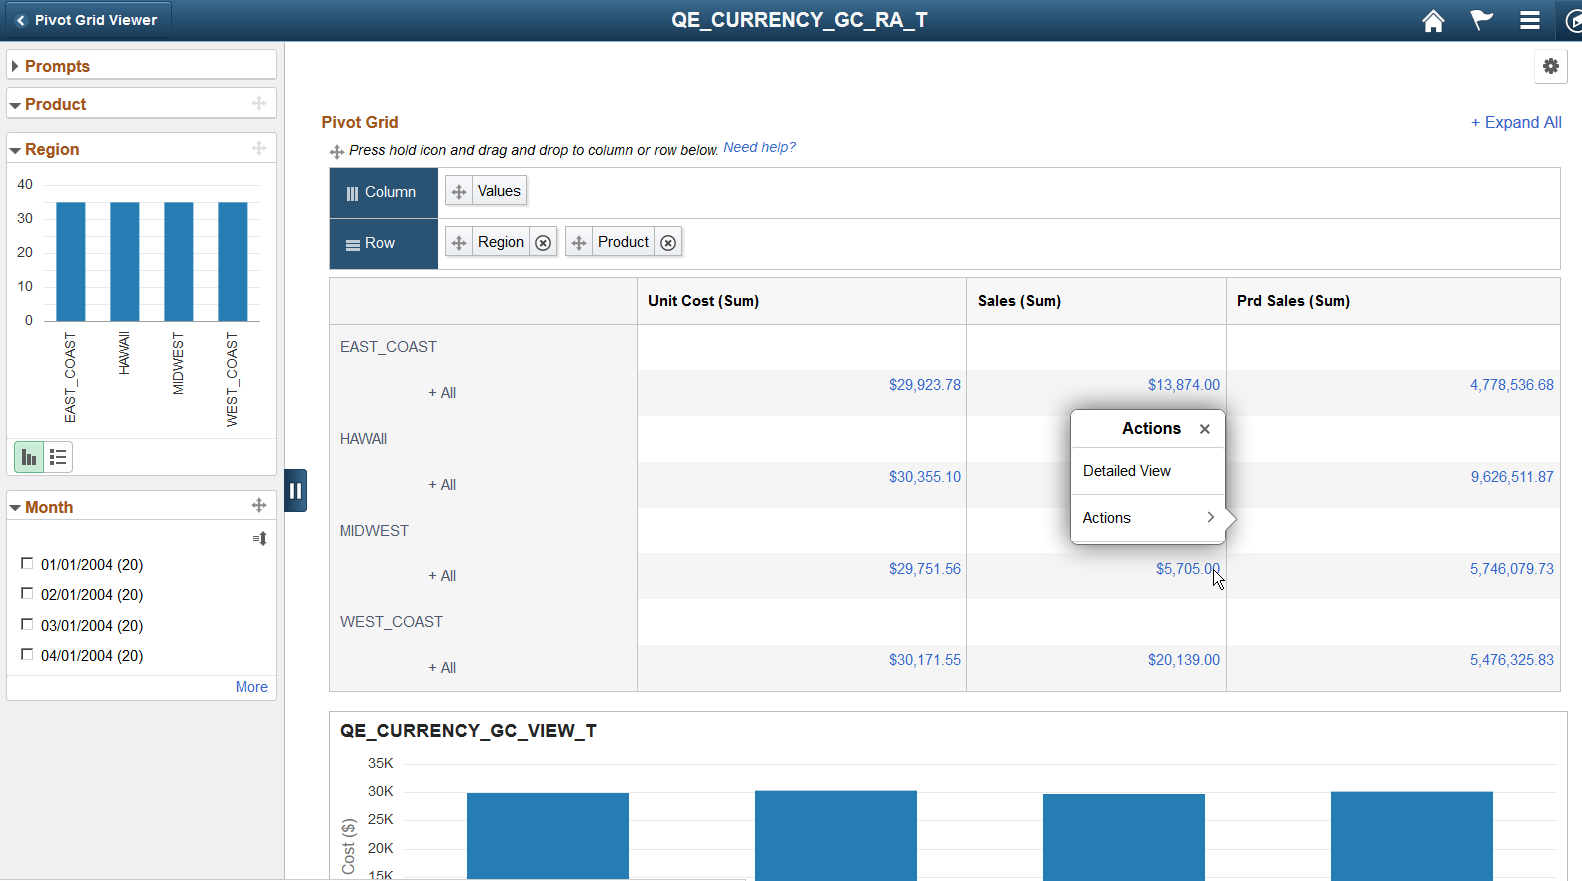
The grid fact data points are actionable. These options are similar to the classic Pivot Grid Viewer.
When bulk-related actions are not configured, clicking the data point on the grid displays the Detail View in a modal for the Grid and List view model.
When bulk related action is configured, clicking the data point populates a menu that enables you to either select an action or drill to the Detail View from that data point.
The filters in the left panel of the fluid view can be dragged onto the regions that are marked with Column and Row labels. You cannot perform drag-and-drop on the filters that include a disabled Drag icon.
Image: Dragging filters to regions in fluid mode
In this example, you cannot drag-and-drop the Product and Region filters because these filters include the disabled Drag icons, but you can drag-and-drop the Month filter because its Drag icon is active.
You can drag-and-drop the axis between the column and the row regions that are above the grid.
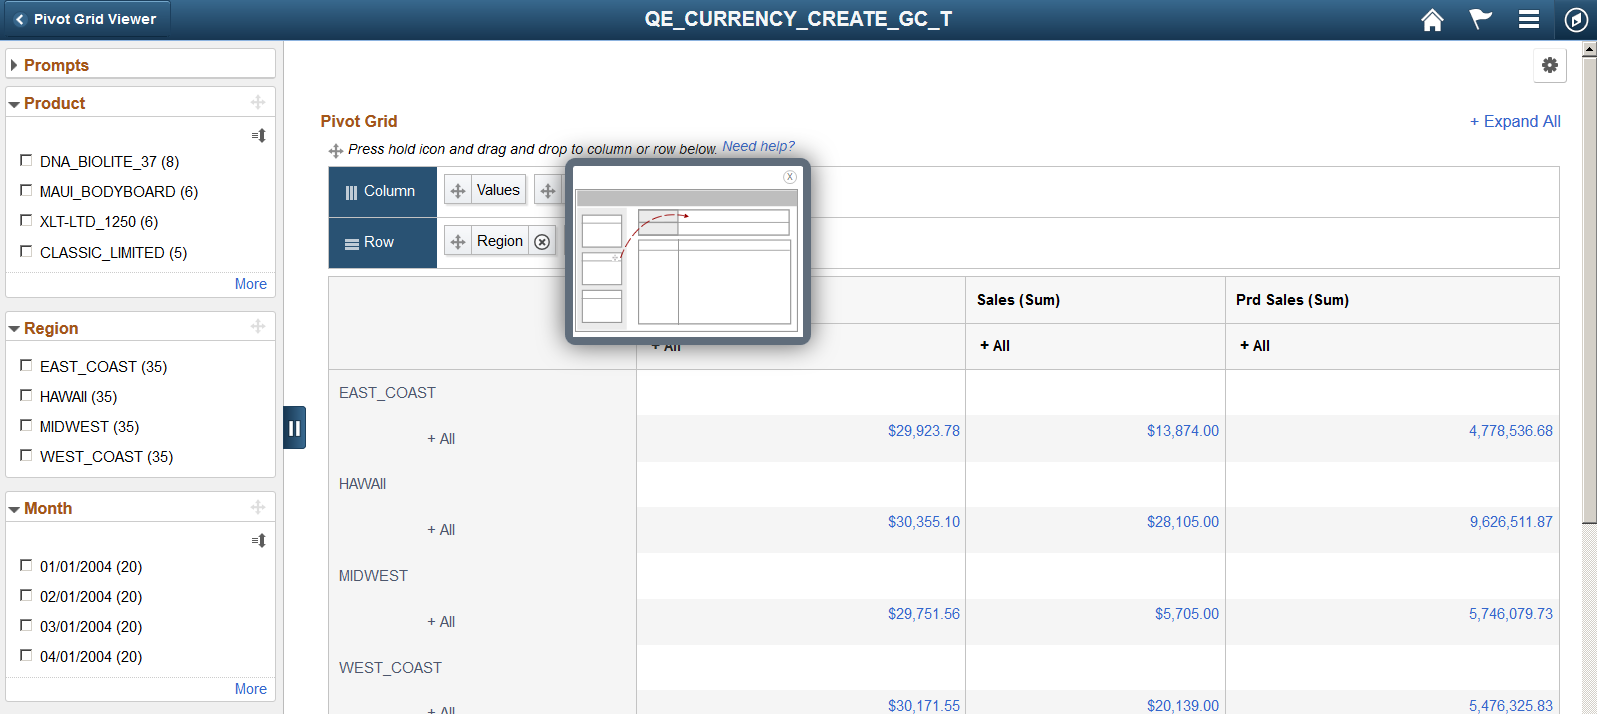
Image: Dragging axis between column and row in fluid mode
This example illustrates how the Product axis is dragged from the Row region to the Column region.
You can change the axis level by performing a dragging and dropping within row or column regions.
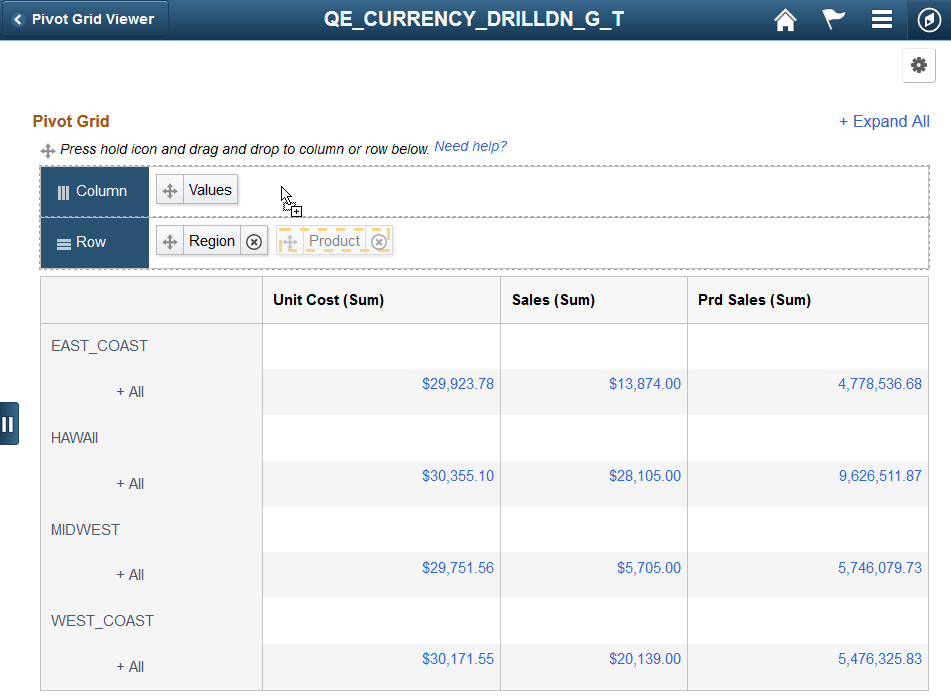
Image: Moving Product axis to Region
This example illustrates how to drag the Product axis and move it to before the Region axis. This move will place the Region axis below the Product axis.
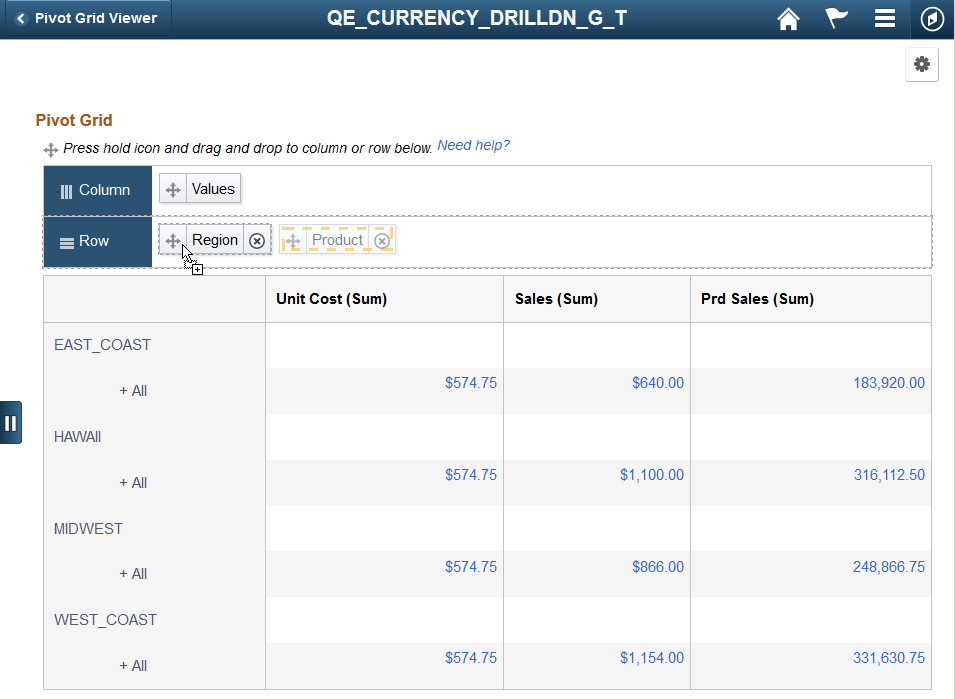
Image: Results of changing the axis level
This example shows the Pivot Grid model after you drag Product axis and drop it on Region.
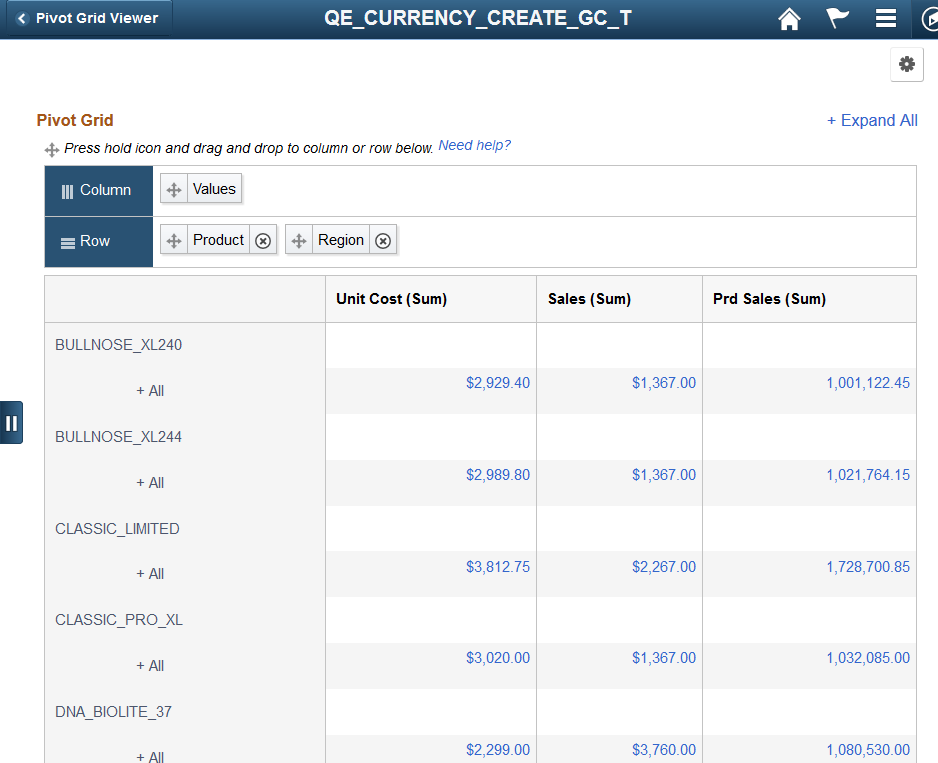
Image: Dragging filters to row or column
This example illustrates how to drag the Month filter from the facet are and move it to the Column region.
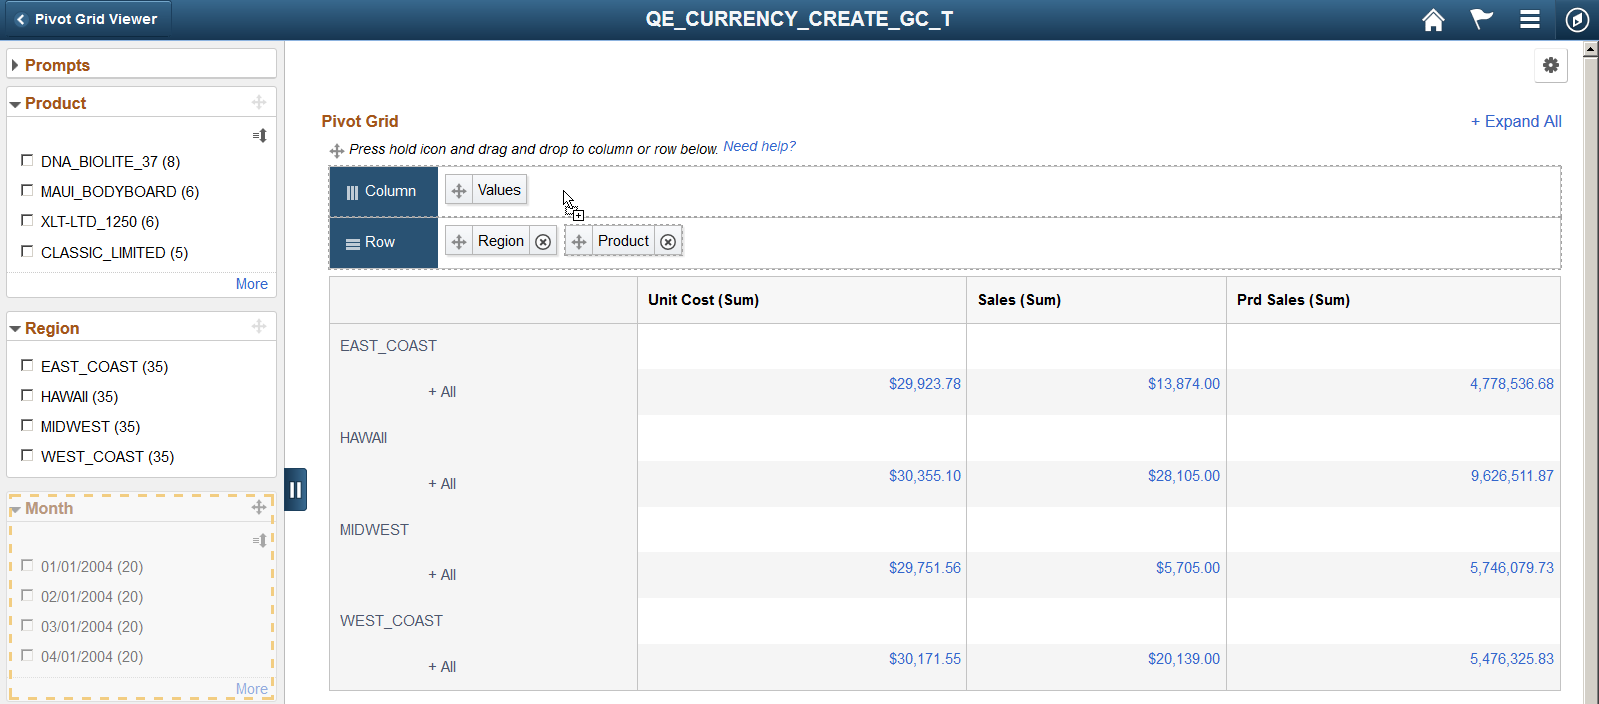
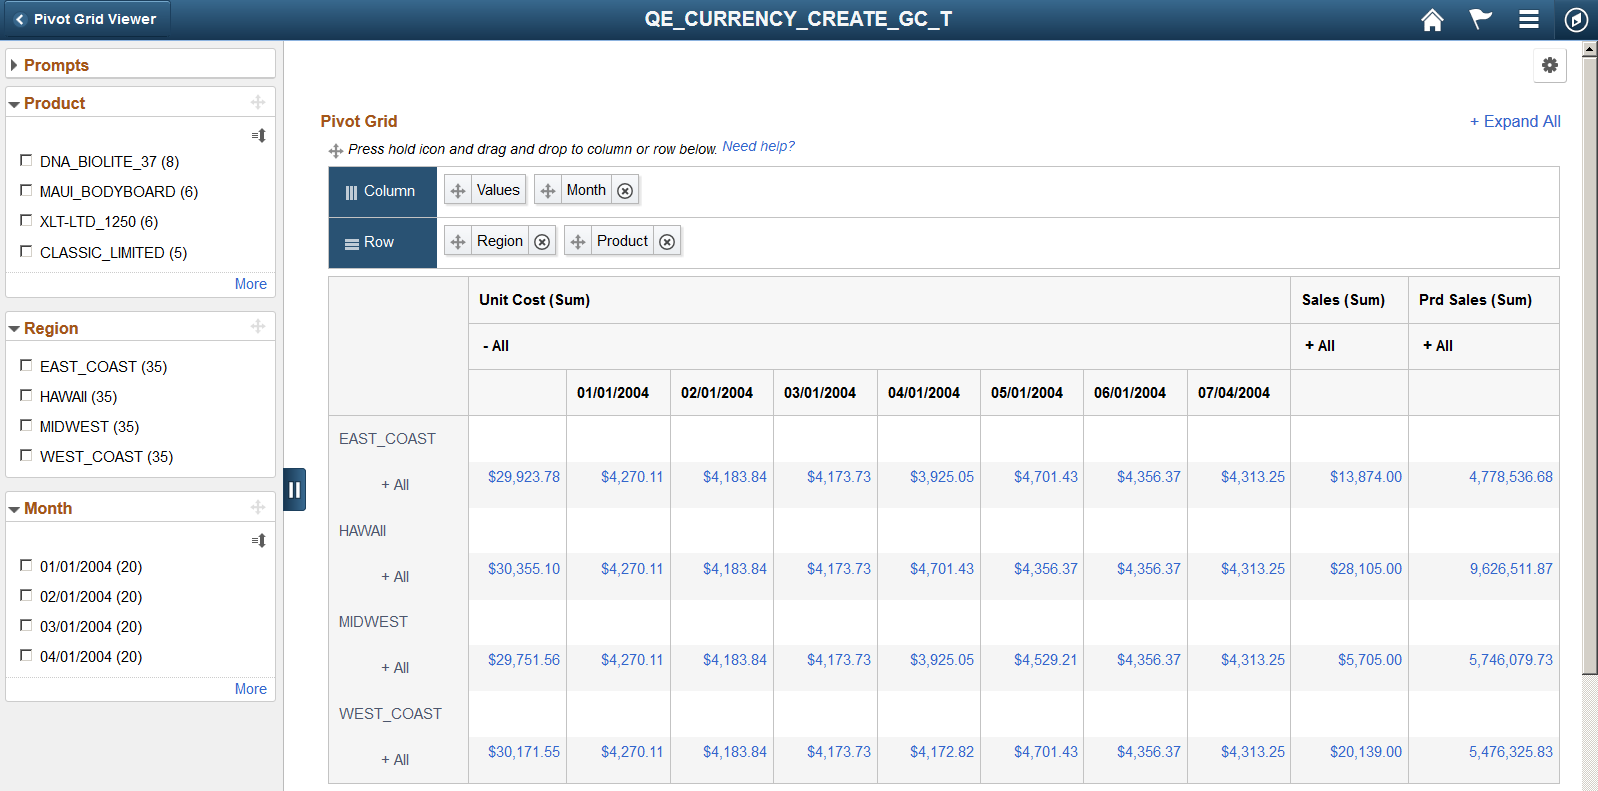
Image: Results of dragging filters to row or column
This example shows the Pivot Grid model after the Month filter is dragged from the facet area and dropped on the Column axis.
You can use the Expand All or Collapse All link at the top right of the grid to expand or collapse all nodes in the grid. This function is similar to that in the classic Pivot Grid Viewer. However, to expand or collapse a single node in the grid, you must click its node label.
Image: Expanding node
This example shows the Pivot Grid Only model after the product node (All) in the HAWAII region is expanded.
If the Pivot Grid model is set to Pivot Grid and Chart, clicking on the chart data point displays the detail view for the data point in a full page modal when there are no aggregate actions. If aggregate action is configured for the Pivot Grid model, selecting the chart data point populates a menu to open the detail view and take aggregate actions.
Image: Interactive chart data points
This example shows the Pivot Grid and Chart model. When aggregate action is configured for the model, clicking the chart data point (5705.00 link) populates a menu to open the detail view and take aggregate actions.