Using Simplified Analytics in Smart Phones
You can use a smart phone to create, edit, and view the analytic reports.
Note: The Simplified Analytic feature supports the Chart and Simple Table views on smart phones, but this feature does not support Pivot Grid view on smart phones. The reports that contain Pivot Grid view (created in tablets or desktop) will not show up on smart phones under the My Analytics section.
These examples show you how to create, edit, or view the analytic reports using smart phones:
Access the fluid component for which you have the Simplified Analytics feature enabled.
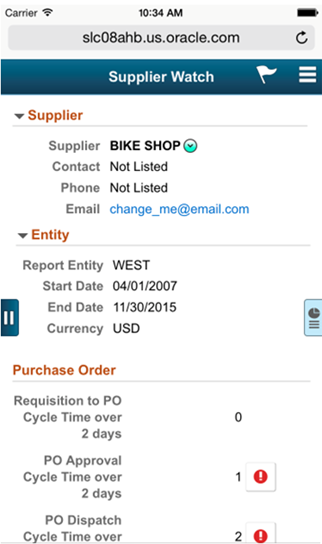
In this example, access the Supplier Watch List component under Procurement Operations.
Image: Supplier Watch List component on a smart phone
This example illustrates the Supplier Watch page on a smart phone displaying the details of supplier, purchase order, and contract information for supplier BIKE SHOP. The Expand icon at the right of the view is used to display the My Analytics section.
Click the Expand icon at the right of the view to expand the right panel that displays the My Analytics section.
Image: My Analytics section on a smart phone
This example illustrates the Supplier Watch page displaying the My Analytics section on a smart phone. The Billing Status analytic report is available.
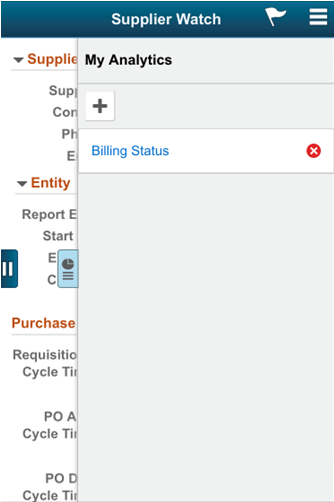
Note: On smart phones, all analytic reports that have the display option set to Pivot Grid View are suppressed and not listed under the My Analytics section.
Click the Add (+) button under the My Analytics section to create a new analytic report.
The Create Analytics Wizard – step 1 appears.
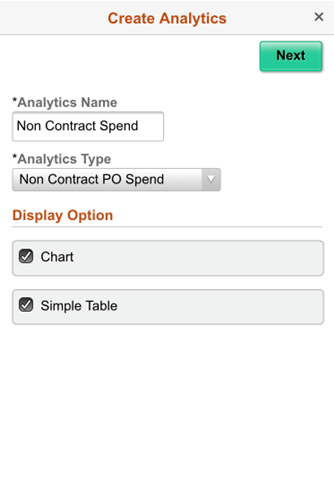
Enter the name of the analytic report into the Analytics Name field.
In this example, enter Non Contract Spend.
Select an analytic report template from the Analytic Type drop-down list.
In this example, select the Non Contract PO Spend option from the list.
Use the Display Option section to set the chart and table views for the analytic report.
Note: Using a smart phone, the available display options are Chart and Simple Table views, and the Pivot Grid view is not available.
Image: Create Analytics Wizard - step 1 on a smart phone
This example illustrates the Create Analytics Wizard - step 1. The analytic report Non Contract Spend will use the analytic template Non Contract PO Spend. The report will display the results in the Chart and Simple Table view.
Click the Next button to display the Create Analytics Wizard - step 2.
Select the prompt values for the analytic report, if any.
In the Non Contract Spend analytic report, select the dates within the last 10 years, from 01/01/2006 to 12/31/2015.
Use the Choose Fields section to select the fields that will be available in the analytic report.
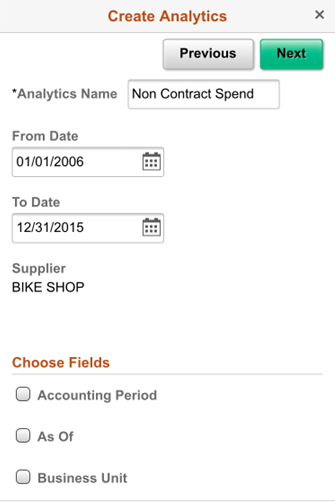
Image: Create Analytics Wizard - step 2 on a smart phone
This example illustrates Create Analytics Wizard - step 2. The Supplier field is read-only because the value for this field is implicitly passed from the transaction page when the Value Required field in the Related Content configuration is selected. The Supplier field is the prompt, and supplier BIKE SHOP is the prompt value for the report.
Click the Next button to display the analytic report preview window.
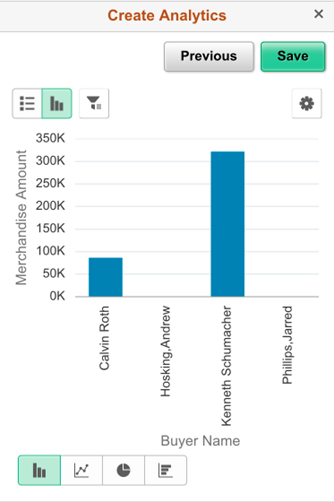
Image: Create Analytics Wizard- step 3 - preview window
This example shows the preview window of the analytic report Non Contract Spend using the analytic template Non Contract PO Spend. The bar chart displays the report for each buyer and their merchandise amount.
Click the List toggle icon at the top-left of the chart to view the results in a list.
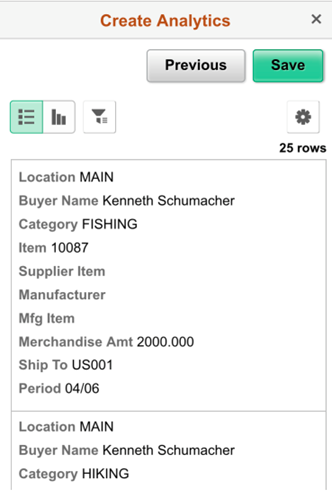
Image: Analytic report displayed in a list view
This example shows the preview window of the analytic report Non Contract Spend using the analytic template Non Contract PO Spend. The list view displays the results based on the fields that you selected in the Create Analytics Wizard - step 2.
Click the Filters (funnel) icon at the top-left of the chart to display the filters fully in a modal window.
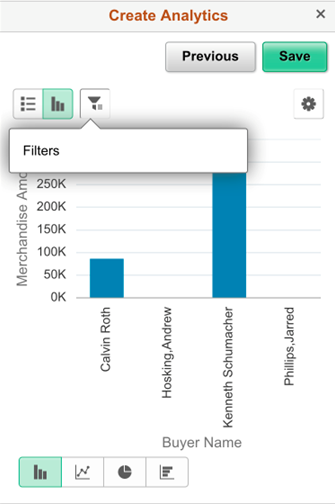
Image: Filters on a smart phone
This example shows the Filters option displayed under the Filters icon.
Use the Chart Options from the Options menu to change the chart display options such as X axis, Series, Y axis, and so on.
Note: On smart phones, you cannot use the drag-and-drop function to change the chart axes.
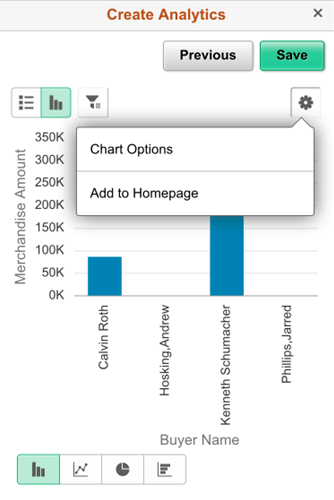
Image: Options Menu on a smart phone
This example illustrates the options from Options menu.
Save the analytic report using the Save button.
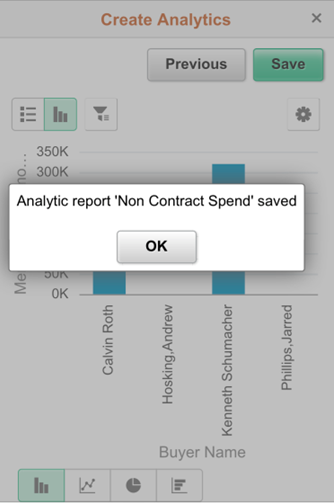
Image: Saving confirmation on a smart phone
This example illustrates the confirmation for saving the analytic report after clicking the Save button.
Return to the Supplier Watch page; the My Analytics section now lists the report that you just created.
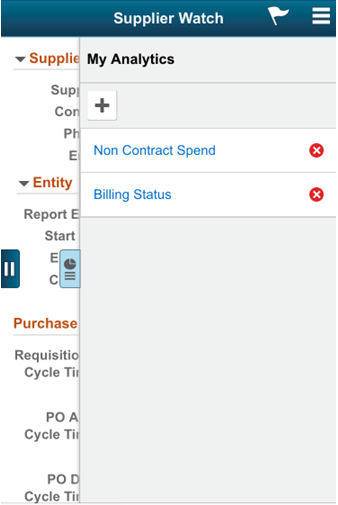
Image: My Analytics section lists the newly created analytic report
This example illustrates the Supplier Watch page displaying the My Analytics section on a smart phone. The Non Contract Spend and Billing Status reports are available.
Click the analytic report link to view the report in a modal window.
In this example, click the Non Contract Spend link.
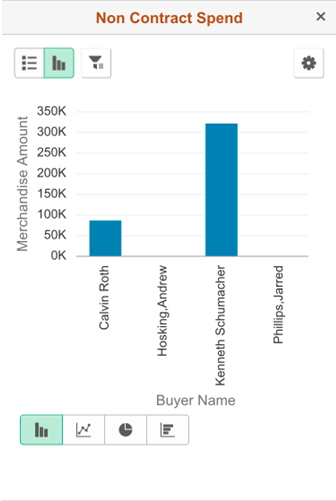
Image: Non Contract Spend report on a smart phone
This example shows the Non Contract Spend report opened fully in a new modal window on a smart phone.
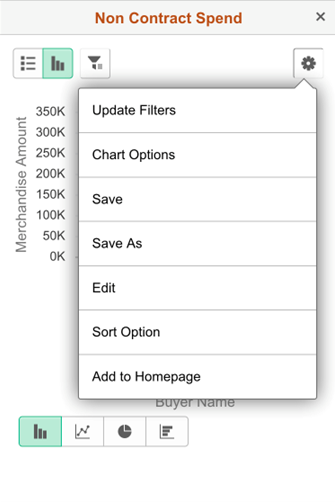
From the analytic report, use the Options Menu to:
Update report filters.
Modify chart options.
Save the analytic report.
Copy the analytic report using the Save As option.
Edit the analytic report.
Set the sort options for the analytic report.
Add the analytic report to the fluid homepage.
Image: Available actions from Options Menu on a smart phone
This example illustrates the available options under the Options Menu icon.
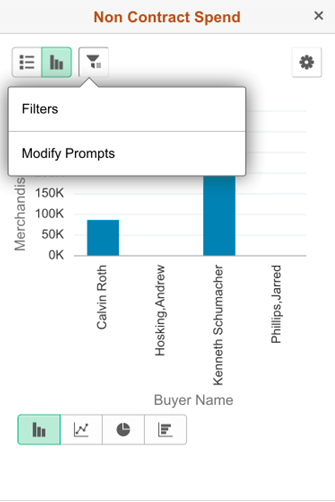
Use the Filters/Prompts (or funnel) icon to edit the filters and prompts.
Image: Filters and Modify Prompts options under the Filters icon
This example illustrates the Filters and Modify Prompts options under the Filters icon.