Viewing Pivot Grid Models Using Pivot Grid Viewer
Use the Pivot Grid Viewer page (PTPG_PSPGVIEWER) to view the Pivot Grid model with different display options: Pivot Grid and Chart, Pivot Grid Only, or Chart Only.
Note: If the display option is Pivot Grid Only, Pivot Grid displays the grid without the chart.
Pivot Grid displays number 0 (zero) in the grid cell if the value on the grid cell is equal to 0.
Navigation
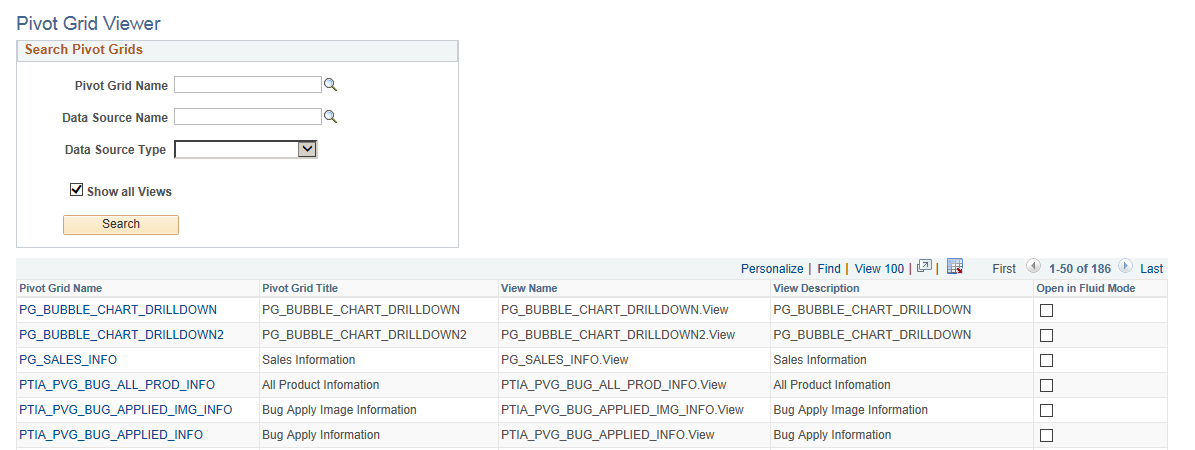
Image: Pivot Grid Viewer search page
This example illustrates the fields and controls on the Pivot Grid Viewer search page. If the Show All Views option is selected, the system displays the default and non-default views associated with the Pivot Grid models.
|
Field or Control |
Definition |
|---|---|
| Pivot Grid Name |
Search using the pivot grid name. |
| Data Source Name |
Search using the data source value. |
| Data Source Type |
Search using PS Query, Component, or Composite Query. |
| Show All Views |
Select to see all views created from a pivot grid model. |
| Open in Fluid Mode |
Select to view the pivot grid in Fluid Mode. |
Note: A search run without any search condition on the Pivot Grid Viewer search page yields a maximum of 1000 search results. If you are looking for a search result which is not already displayed within the 1000 rows, then use a search condition to refine your search.
The screenshots listed below illustrate the view of pivot grid models with the following default views which can be configured in Pivot Grid Wizard, Specify Data Model Options page:
Pivot Grid Viewer page displaying chart only.
Pivot Grid Viewer displaying grid only.
Pivot Grid Viewer displaying grid and chart.
See, Specifying Data Model Options, to configure the default view of your pivot grid.
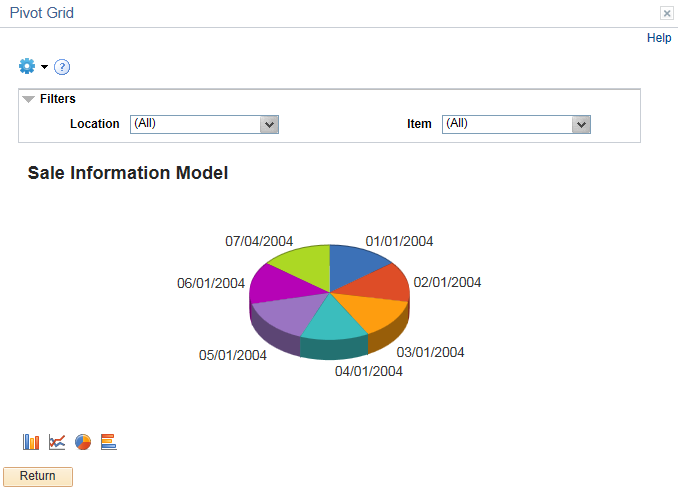
Default View as Chart Only
Image: Pivot Grid Viewer page displaying chart only
This example illustrates the fields and controls on the Pivot Grid Viewer page with the default display of Chart Only.
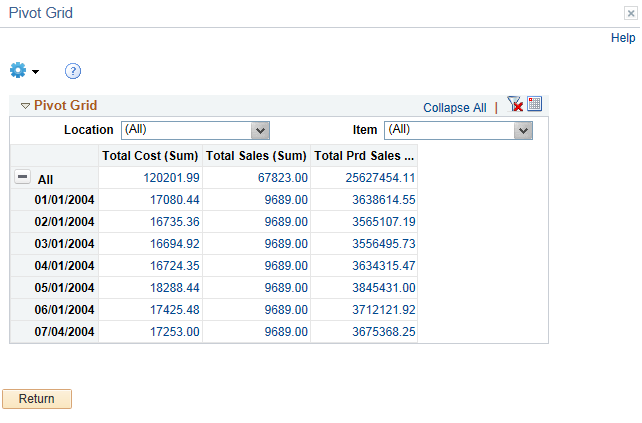
Default View as Pivot Grid Only
Image: Pivot Grid Viewer displaying grid only
This example illustrates the fields and controls on the Pivot Grid Viewer page with the default display of Pivot Grid Only.
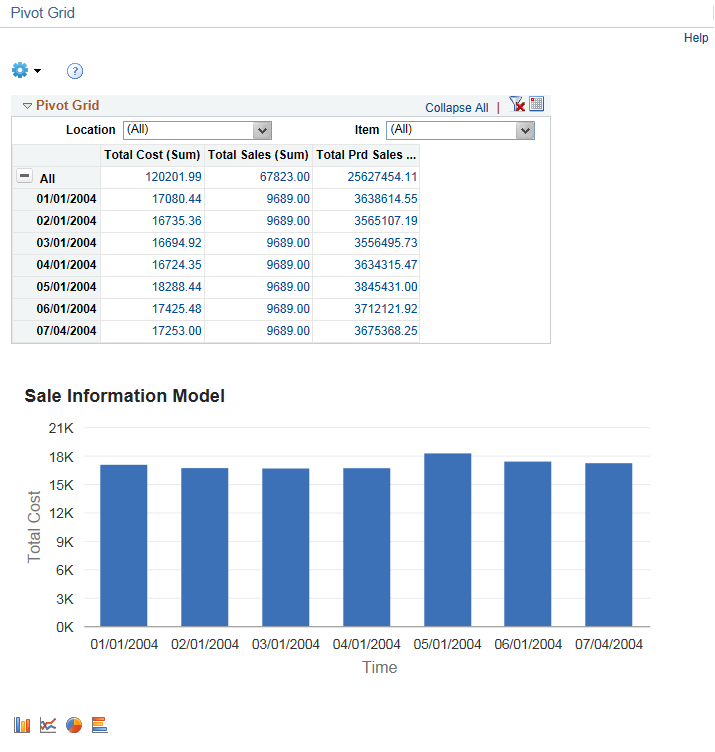
Default View as Pivot Grid and Chart
Image: Pivot Grid Viewer displaying grid and chart
This example illustrates the fields and controls on the Pivot Grid Viewer page with the default display of Pivot Grid and Chart. Definitions for the fields and controls appear following the example.
|
Field or Control |
Definition |
|---|---|
 |
Use the Option Menu icon to select the actions for viewing the Pivot Grid model.
Note: Pivot Grid displays actions in the Option Menu drop-down list based on the viewing mode that you have set for the current Pivot Grid model. |
 |
Click the Help icon to display the Help - Pivot Grid dialog box, where you can view the help information for all actions in this page. You can define the Help icon and its embedded help information for each Pivot Grid model using the Show Help option in the Pivot Grid Wizard - Specify Data Model Options page, Viewer Options section. See Creating a New Pivot Grid Pagelet Using the Pagelet Wizard. |
| <Pivot Grid name> |
In the grid section, you can change the grid layout at runtime by dragging members to a different axis. |
| Expand All and Collapse All |
The Expand All and Collapse All links appear when the Pivot Grid model contains dimensions with totals on the lowest level of the grid row or column. These links are not available for the Pivot Grid models that have no totals defined for dimensions on the grid row and grid column. Click the Expand All link to expand all the positions on the grid row and column, and the Collapse All link appears. Click the Collapse All link to collapse all the positions on the grid row and column, and the Expand All link appears. |
 |
Click the Hide Filter icon to collapse the section that displays the Pivot Grid filter options for the Pivot Grid models that have the grid-only mode. |
 |
Click the Show Filter icon to expand the section that displays the Pivot Grid filter options for the Pivot Grid models that have the grid-only mode. |
| Filter |
Displays the Pivot Grid filter options for the Pivot Grid models that have the chart-only mode. You can click to collapse or expand the section. The default setting is the expanded state. |
 |
Click the Download icon to download the slice of data seen in the pivot grid to Microsoft Excel. |
 |
Click the Show All Columns icon to display all the grid columns. |
 |
Click the Show Scrolling icon to display columns in a scrollable grid. |
 |
Click the Bar icon to display data in a bar chart. |
 |
Click the Line icon to display data in a line chart. |
 |
Click the Pie icon to display data in a pie chart. |
 |
Click the Horizontal Bar Chart icon to display data in a horizontal bar chart. |
| <Chart> |
If the Related Actions are not configured for the aggregate view, clicking the data point on the chart enables you to directly access the detailed view to view the data that is being plotted. If the Related Actions are configured on the aggregate view, clicking the data point on the chart displays a context menu with a list of available actions: Detailed View, Drilldown To, and Actions. Note: Beginning from PeopleTools 8.54, you select a chart data point in a Pivot Grid and Chart view to see the detail view for the data point or perform aggregate related actions (if configured). You can change PSQuery runtime prompt values. |
| Return |
Click the Return button to close the Pivot Grid view and return to the Pivot Grid Viewer page. |