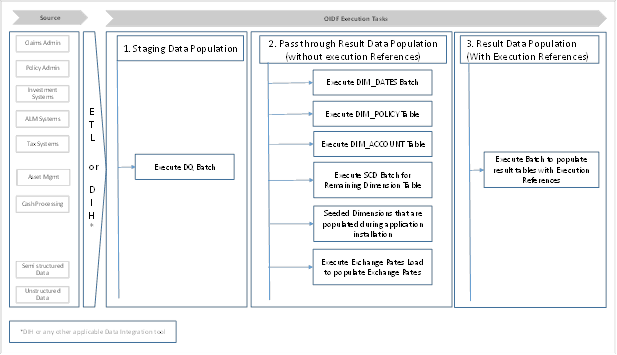
This representative data flow diagram of the Data Foundation application illustrates its data flow stages, input and output types, output usage, and the processes that populate results.
The data flow process can be categorized into two main categories. They are:
In this process, data is populated into the Data Foundation Stage master tables and Stage tables using these sub-processes:
a. Run Custom ETL/DIH.
b. Execute Data Quality batches.
2. For more information about loading Stage tables, see the section Loading OFSAA Staging Tables.
3. Populating Result Tables
4. In this process, data is populated in Dimension and Result tables using Stage tables. The sequence of sub-processes are:
a. Dimension Loading Process:
i. Populate DIM_DATES table.
ii. Seeded Dimensions that are populated during the installation process.
iii. Populate DIM_ACCOUNT and DIM_POLICY tables.
iv. Execute other SCD batches to populate corresponding Dimensions.
v. Load key Dimensions using AMHM.
b. Loading data into the Result tables using T2T batch execution process.
These Result tables are used by other Analytical Applications to create reports. Some of the applications are listed here:
· IFRS17
· Solvency II
· Customer Insight