Home Page / Dashboard
The Dashboard is the Admin Console's Home page or landing page. When a user logs in, Admin Console allows every valid user access to the Home page / Dashboard.
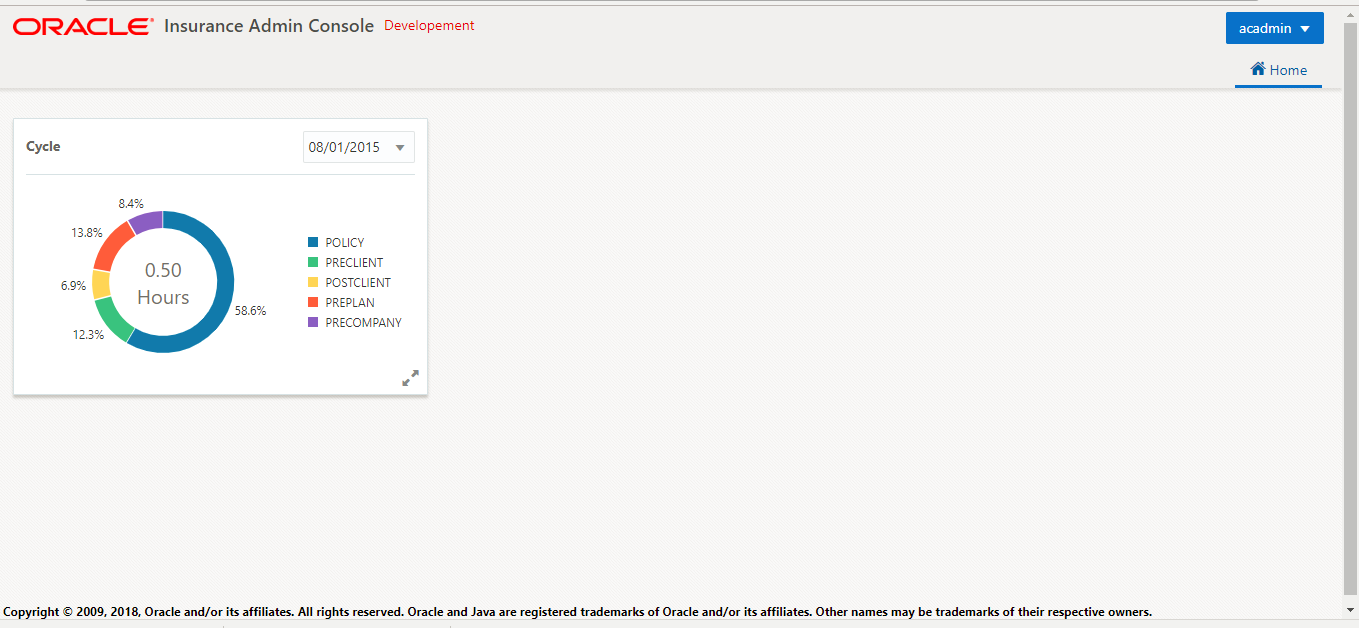
Cycle Chart
The Dashboard displays the Cycle chart, and by default represents the latest cycle data. The chart lists the dates of the cycle data that is persisted.
The user can choose a date from the drop down list to view the chosen date’s Cycle data. The data will be presented by "doughnut" chart. In the chart,
- All executed cycle steps for the system date are represented by a specific color in the circle and expresses the percentage of time that each step took relative to the total accumulated time of all the steps.
- When there are multiple executions for the same cycle step, the chart represents an aggregation of all the individual executions.
Note: The details, non-aggregate view, can only be viewed by choice in the Complete Cycle page.
- The center expresses in hours the total accumulated time of all the cycle steps in the system date's completed cycle.
The user can click the chart to navigate to the Complete Cycle page. If there is no cycle data, "No data to display' message will be displayed.

