Using Discover in Studio, you analyze the data and discover insights hidden in data. Discover lets you identify and pick meaningful visualizations and capture the results of the data exploration phase.
You can find the Discover area of Studio here:
![]()
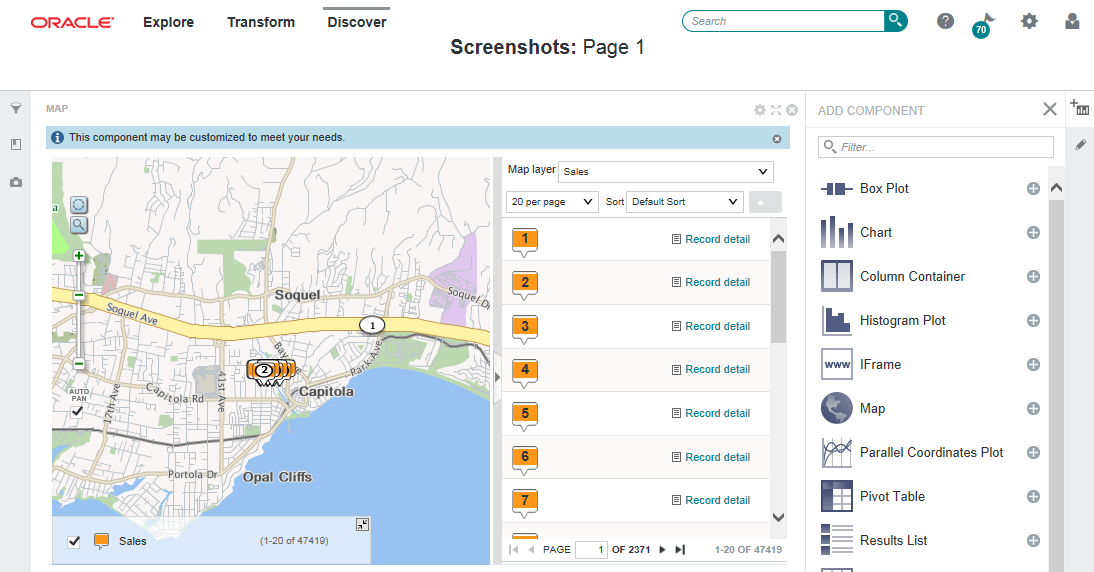
Here is an example of how Discover might look for your project:

In this diagram, you can see the Discover area, with the Map visualization added. To the right, notice some of the other visualization components you can add to your project.
Some of the
examples of the insights you can create with
Discover are:
- Use search and Guided Navigation to identify subsets of data for deeper analysis.
- Use interactive visualizations to let the data speak for itself, in raw or aggregated forms, in text or in numbers. Statistical techniques (regression, correlation) and machine learning tools (classification, clustering) are used in Big Data Discovery to drive these visualizations.
- Join (or combine) multiple data sets for new insights.
- Create projects that serve as models for different outcomes. These models automatically understand the weight of different factors in contributing to given outcomes without requiring experts to hand-code rules or heuristics.
- Add new data to existing projects or run your projects on existing data that has been altered to examine new scenarios. (This is known as "what if" analysis.)
- Export your data sets from Big Data Discovery back into Hadoop, so that you can run complex models built in other tools (such as R, or Python) on your custom-created data sub-sets, such as on different customer segments.
