2. Oracle FLEXCUBE Testing Workbench
Oracle FLEXCUBE Testing Workbench helps you create a replica of the production database on a separate environment. You can perform the following actions from OFTW:
- Subset Creation - Create miniature test environment
- Recording - Record user activity
- Replay - Replay the recorded user activity in target test environment
- Result verification - Verify the replayed data with the data from recorded environment
This chapter contains the following sections:
- Section 2.1, "Creating Subsets"
- Section 2.2, "Record User Actions"
- Section 2.3, "Replaying Recorded Actions"
2.1 Creating Subsets
You need to create a replica of the source/UAT database. Using OFTW, you can create a subset of the source data. The customer specific confidential data can be masked to ensure confidentiality.
This section contains the following topics:
- Section 2.1.1, "Maintaining Environment Codes"
- Section 2.1.2, "Maintaining Test Beds"
- Section 2.1.3, "Maintaining OFTW Type"
- Section 2.1.4, "Export/Import of Data"
2.1.1 Maintaining Environment Codes
The environment component contains the parameters to extract data from the source database with the type of export method that the OFTW uses.
You can maintain the environment codes using ‘Environment Code Maintenance’ screen. To invoke the screen, type ‘STDOFENV’ in the field at the top right corner of the application toolbar and click the adjoining arrow button.

Specify the following details:
Environment Code
Specify the name of the environment code.
Description
Enter a description of the environment code.
Export Method
Specify the method of exporting the data to test bed schema. Select one of the following options:
- DATA PUMP (Recommended)
- OTHERS
Usage Type
Select the usage type.
- Same Version-Patch: Use this option when the data structures remain the same between test bed and replay environment. This is typically used in regress testing the patch set releases, emergency code fixes etc.
- Version Upgrade: Use this if the Oracle FLEXCUBE Universal Banking version has been upgraded and there is a need for testing the new version software.
- Load/Stress Testing: You can use the record and replay data for testing a huge set of similar transaction on the system.
Input Date
The system updates the current application date automatically on saving the details. This is used for generating the dump files, PAR files and shell scripts with this date.
Environment Migration
Select the environment migration type.
- AS IS: The ‘As is’ environment migration is used if the entire source data has to be migrated as it is to the other schema. This is suitable for recording a day(s) transactions in source environment and replaying it in a disaster recovery schema or testing version upgrades. Using this option would force the bank to use the same set of hardware and software in the test bed environments. This is not suitable for subset creation.
- Percentile: ‘Percentile’ environment migration is used if only a certain percentage of the source data has to be migrated to the other schema. It includes only the specified branches and modules and the customers under those module and branch.
- Selection: ‘Selection’ environment migration is used if only a particular or a set of particular source data has to be migrated to the other schema. It includes only the specified branches and modules and the customers under those module and branch.
- Percentile & Selection: ‘Percentile & Selection’ environment migration is used if a particular or a set of particular data and percentage of the source data has to be migrated to the other schema. It includes only the specified branches, modules and customers under that module and branch.
Other Branch Customer Type
Select the customer type of the other branch.
- Current Branch: Select this option if the export should contain the customers in the selected branches only.
- Include Parent Branch: Select this option in the customer type is used for export of the customers in the selected branches and parent/regional branches of the selected branches.
- All Branches: Select this option to export the customers in the all the branches, irrespective of the selected branches. Effectively all branches static data along with maintenances except for its transactions will get exported. If the option ‘Transactions Required’ is selected, then all transactions of all the customers will be exported.
Database Details
You ned to specify the following details under database details.
Schema Name
Specify the schema name for the source and test bed environments.
Connection String
Specify the schema connection string for the source and test bed environments.
IP Address
Specify the IP address for the source and test bed environments.
Table Space Name
Specify the table space name for the source and test bed environments.
JNDI name
Specify the JNDI name for the source and test bed environments.
Dump Directory
Specify the directory name/path for the source and test bed environments in which the dump file export/import scripts will be generated.
Reports Path
Specify the directory name/path for the source and test bed environments in which the reports will be generated during record/replay.
DB Link for OFTW
Specify the DB link for the source and test bed environments pointed to the OFTW schema.
There are three schema in OFTW, namely, Source Database, Recording and Replay. For all these, you need to provide the database details such as database name, JNDI name, IP address, Dump directory path, report path and the scripts path.
Note
For recording and replay schema, you can provide the details in the tabs ‘Record Credentials’ and ‘Replay Credentials’ respectively.
2.1.1.1 Record Credentials
Specify the database details for the record credentials.
Refer to the above section for details.
2.1.1.2 Repay Credentials
Specify the database details for repay credentials.
Refer to the above section for details.
2.1.2 Maintaining Test Beds
You need to create the test bed, which decides the branches, number of customers and transactions that will be included in the export file. You can maintain test beds using ‘Test Bed Maintenance’ screen. To invoke this screen, type ‘STDOFEXP’ in the field at the top right corner of the application toolbar and click the adjoining arrow button.

Specify the following details:
Environment Code
Select the environment code from the option list. Once you have selected the environment code, click ‘Auto Populate’ button to default the other details.
Usage Type
Based on the environment code selected, the system displays the usage type. You cannot modify this.
Environment Migration
Based on the environment code selected, the system displays the environment migration. You cannot modify this.
Other Branch Customer Type
Based on the environment code selected, the system displays the other branch customer type. You cannot modify this.
Include Transaction
Specify whether to include the transaction data while exporting the subset. You can select one of the following options:
- None
- Active Contracts
- Closed Contracts
Mask Export Data
Check this box to mask the customer sensitive data while exporting. This is a manual option and the DBA needs to exercise this. If OFTW is being used as a standalone schema, this step is also automated.
Upload File Name
If the environment migration type is ‘Percentile and Selection’, then you need to enter the file name for upload. After specifying the file name, click ‘Process Upload’ button to initiate the upload.
In order to use the upload option, you need to place the upload text file (<FileName>.TXT) in the directory path of the source schema.
Once the upload has been processed, the system generates a log file with the comments whether the customer details are uploaded or not and the reasons.
Head Office
The system displays the respective head office branch code.
Head Office Name
The system displays the head office branch name.
The data of this branch is exported by default. If you have selected ‘Include Transaction’, then head office transaction data is also exported.
Note
You need to set a validation/technical change to include head office in the exporting the data.
2.1.2.1 Branches Tab
You need to specify the details in the ‘Branches’ tab only if the migration type is ‘Percentile’ or ‘Selection’.
Branch
Specify the branch code based on the percentage or selection.
Branch Name
The system displays the name of the branch.
Customer
Specify the customer numbers under the selected branch. This is applicable only if the migration type is ‘Selection’.
Name
The system displays the name of the customer.
2.1.2.2 Modules Tab
You can view the module details if the migration type is ‘Percentile’ or ‘Selection’, based on the selected branch.

Specify the following details.
Module
Specify the respective module code.
Active Contracts
The system displays the number of active contracts in that particular branch.
Module Wise %
The system displays the percentage of a particular module in the overall percentage selected.
2.1.2.3 Customers Tab
You can indicate the customer details for a selected branch in ‘Customers’ tab. This is applicable only if the migration type is ‘Selection’.
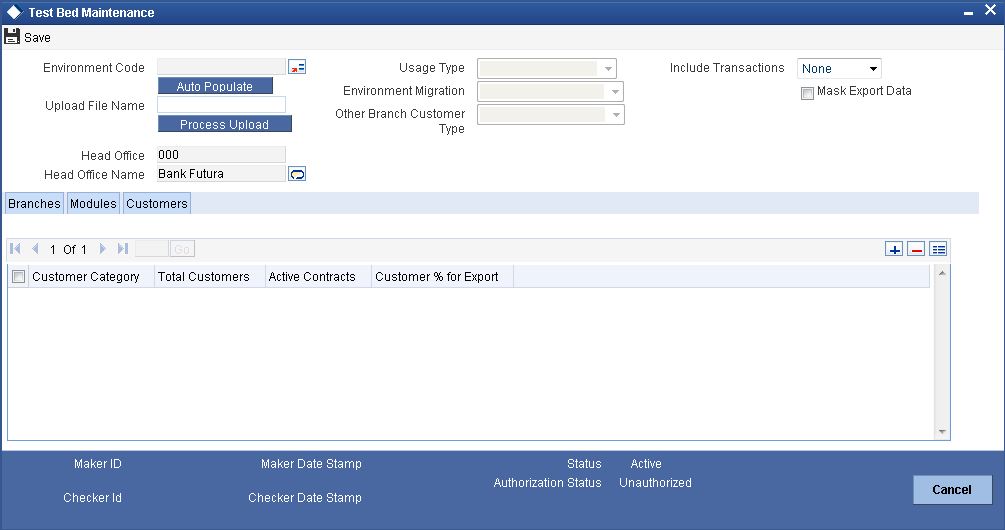
Specify the following details:
Customer Category
Specify the customer category. The option list displays all valid categories maintained in the system. Select the appropriate one.
Total Customers
The system displays the number of customers under the respective category based on the selection of branch or module.
Active Contracts
The system displays the number of active contracts under the respective customer category based on the selection of branch or module.
Customer % for Export
If you select this, the system allows migration of the specified percentage of customer data as part of subset creation.
2.1.3 Maintaining OFTW Type
OFTW type decides the parameters for the tables in exporting the data. This data is factory shipped for all the tables. You also have a provision to add new customised tables as part of the export.
You can maintain OFTW types using ‘OFTW Type Maintenance’ screen. To invoke this screen, type ‘STDOFTYP’ in the field at the top right corner of the application toolbar and click the adjoining arrow button.
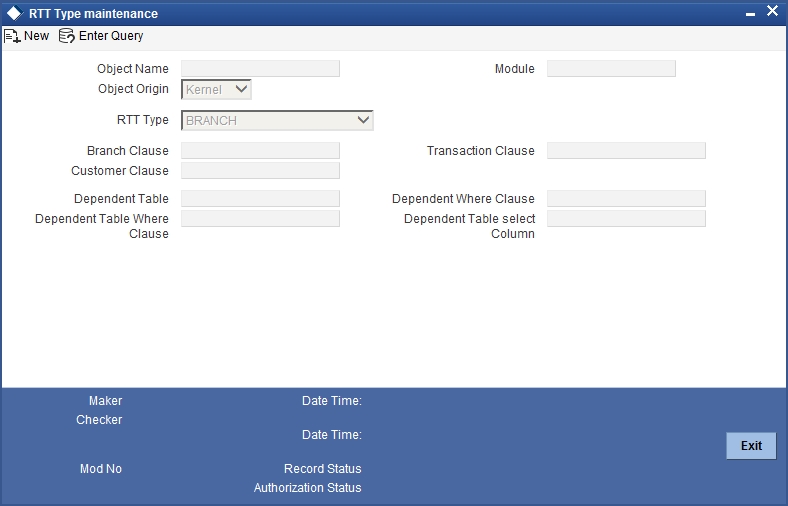
Specify the following details:
Object Name
Specify the table name.
Object Origin
Specify the table release type. You can select one of the following origins:
- KERNEL (data cannot be created or modified through the front end for these types of object)
- CUSTOM
Type
Specify the type of table. Select one of the following options:
- IGNORE: Export will ignore these types of data
- COMMON: Entire table to be exported
- BRANCH: Branch related table
- CUSTOMER: Customer related table
- CONTRACT: Contract related table
- DEPENDENT_CUSTOMER: Table linked through its parent of customer type
- DEPENDENT_TRANSACTION: Table linked through its parent of transaction type
Module
Specify the module code of the table.
Branch Clause
Specify the branch column name of a branch type table.
Transaction Clause
Specify the transaction column name of a transaction type table.
Customer Clause
Specify the customer column name of a customer type table.
Dependent Table
Specify the parent table name in case it is linked through its parent.
Dependent Table Where Clause
Specify the column name used to link the parent and its parent.
Dependent Where Clause
Specify the column name of the child table used to link it with its parent.
Dependent Table Select Column
Specify the column name of the parent table.
2.1.4 Export/Import of Data
You can trigger the export or import process for an environment as on a given date. For this operation, the export operation should be ‘DATAPUMP’. To invoke ‘Export/Import’ screen, type ‘STDOFSCR’ in the field at the top right corner of the application toolbar and click the adjoining arrow button.
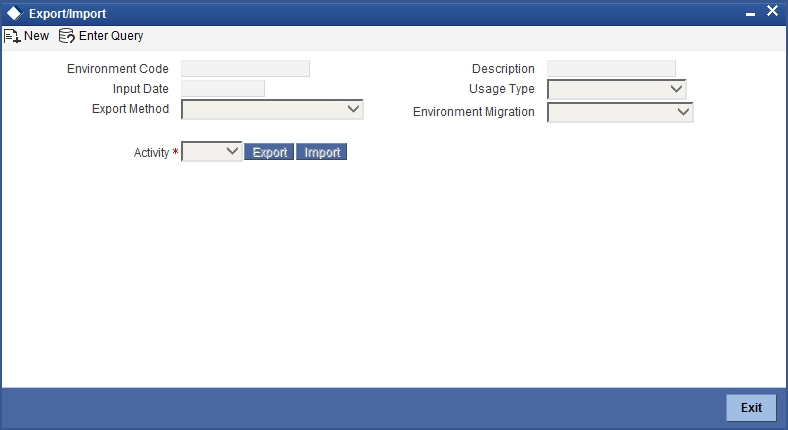
Specify the following details:
Environment Code
Specify the environment code for which you need to initiate the export process.
Description
The system displays the description of the environment.
Input Date
Specify the date as on which the export should process.
Usage Type
Select the usage type from the drop-down list.
Export Method
Select the export method from the drop-down list.
Environment Migration
Select the environment migration from the drop-down list.
Activity
Select the activity, that is export or import, from the drop-down list.
Once you have specified the details, click ‘Export’ button to begin the export process.
2.1.4.1 Scheduling Exports
You can schedule the export process for a specific environment code to begin during MARK TI stage of end of day operations. This is applicable if the export option is ‘DATAPUMP’. To invoke ‘Schedule Export Maintenance’ screen, type ‘STDOFSCH’ in the field at the top right corner of the application toolbar and click the adjoining arrow button.
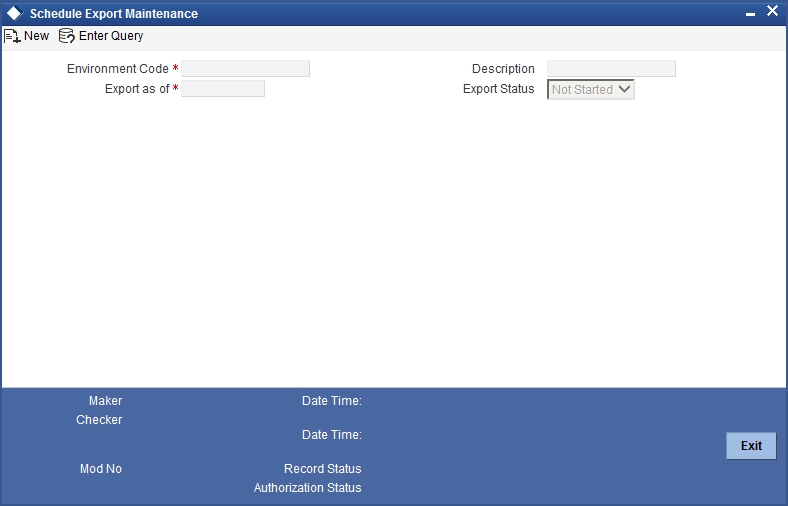
Specify the following details:
Environment Code
Specify the environment code for which the export schedule is being maintained.
Description
The system displays the description of the environment code.
Export as of
Specify the date on which the export should be triggered.
Export Status
The system displays the status of the export. It can be one of the following:
- Not started
- Processed
2.1.4.2 Monitoring Export/Import Process
You can monitor the export/import process for a particular environment code using ‘Export\Import Monitor’ screen. To invoke this screen, type ‘STDOFMTR’ in the field at the top right corner of the application toolbar and click the adjoining arrow button.
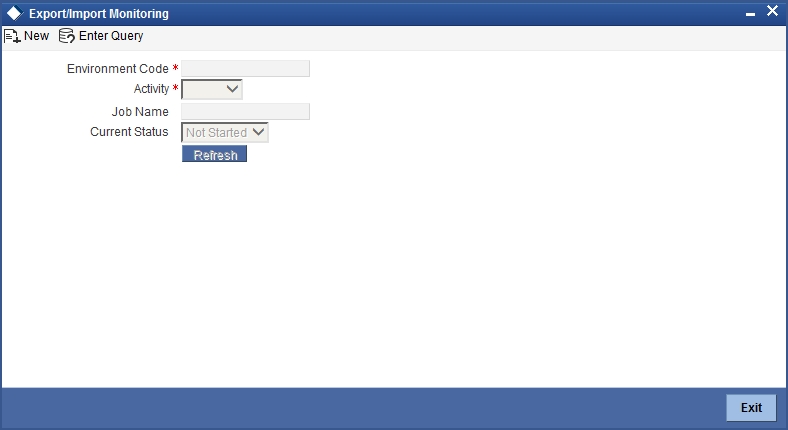
Specify the following details:
Environment Code
Specify the environment code.
Activity
Specify the activity name.
Job Name
The system displays the job name for the selected environment code and activity.
Current Status
The system displays the current status of the job. This can be one of the following:
- Not Started
- Running
- Halted
- Completed
You can anytime click ‘Refresh’ button to know the realtime status of the job.
2.2 Record User Actions
This section contains the following topics:
- Section 2.2.1, "Recording User Actions"
- Section 2.2.2, "Monitoring Recording"
- Section 2.2.3, "Recording Reports"
2.2.1 Recording User Actions
You can record the transactions based on the selective or all user sessions, external sources and function IDs using ‘Recording’ screen. To invoke this screen, type ‘STDOFARC’ in the field at the top right corner of the application toolbar and click the adjoining arrow button.

Specify the following details:
Recording ID
Specify a unique ID for the recording.
Description
Enter a brief description of the recording.
Environment Code
Specify the environment code for which the session is being recorded.
All User Session
Check this box to record all user sessions.
All External Source
Check this box to record the session for all external sources.
All Function IDs
Check this box to record the session for all function IDs.
User Sessions
Specify the users whose sessions should be excluded from the recording.
External Sources
Specify the external sources which should be excluded from recording.
Function IDs
Specify the function IDs which should be excluded from the recording.
Click ‘Recording On’ button to begin the recording of sessions. You can turn off the recording by clicking ‘Recording Off’ button.
2.2.2 Monitoring Recording
You can monitor the status of user session recording using ‘Recording Monitor’ screen. To invoke this screen, type ‘STDOFARM’ in the field at the top right corner of the application toolbar and click the adjoining arrow button.

You view the following details based on the recording ID:
Recording ID
Specify the recording ID whose details you need to monitor.
Description
The system displays the description of the recording ID.
Recording Status
The system displays the status of the recording.
Recording Results
You can view the following details in the result section:
- Total number of records
- Total number of records that failed
- Total number of records that succeeded
Recording Details
You can view the following details in this section:
- Branch code
- User ID
- Function ID
- Action
- Response status
- Key names
- Key values
- Error code
Click ‘Record XML’ button to view the record xml details.

In this screen, you can view the request XML and response XML details, based on the message identification.
2.2.3 Recording Reports
The system generates the following reports before and after the recording session.
- Accounts Report
- Balance Sheet Report - Branch Wise
- Combined balance Sheet Report
- Customer Report
- GL Report - Branch Wise
- Trail balance Report - Branch Wise
You can use these reports to view and compare the status of the transactions before and after the recording.
2.3 Replaying Recorded Actions
You can replay the recorded user actions for verification. To enable replay, you need to first maintain the run charts. The replay takes place based on the logical grouping of messages in the run chart maintenance.
This section contains the following topics:
- Section 2.3.1, "Maintaining Run Charts"
- Section 2.3.2, "Starting Replay of Recorded Actions"
- Section 2.3.3, "Viewing Replay Summary"
- Section 2.3.4, "Monitoring Replay"
- Section 2.3.5, "Replay Reports"
2.3.1 Maintaining Run Charts
A run chart decides the recording messages that should forma part of a replay. You can maintain run charts using ‘Run Chart Maintenance’ screen. To invoke this screen, type ‘STDOFARN’ in the field at the top right corner of the application toolbar and click the adjoining arrow button.
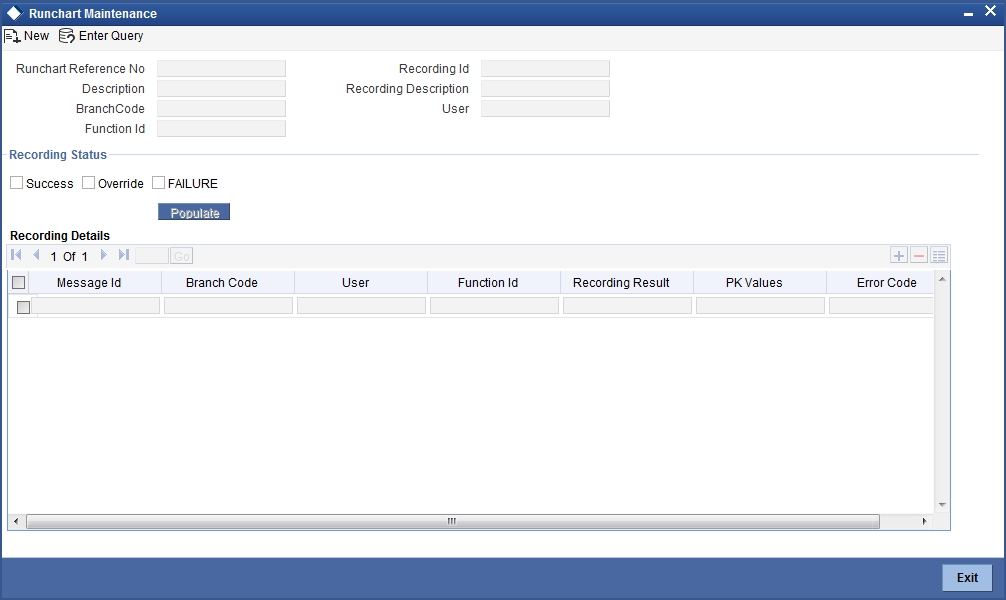
Specify the following details:
Run Chart Reference Number
The system generates and displays the reference number. You can use this later to identify the run chart maintenance.
Description
Enter a brief description of the run chart.
Recording ID
Specify the recording ID which you need to replay.
Recording Description
The system displays the description of the recording.
Once you have specified the above details, click ‘Populate’ button. The system displays the following details of each message in the recording.
- Message ID
- Branch code
- User
- Function ID
- Recording result
- PK values
- Error code
Select the messages that you wish to include in the run chart. When you replay this run chart, the system will include only the selected messages.
2.3.1.1 Viewing Run Chart Summary
You can view a summary of the run charts maintained in the system using ‘Run Chart Summary’ screen. To invoke this screen, type ‘STSOFARN’ in the field at the top right corner of the application toolbar and click the adjoining arrow button.

You can search for the run charts based on the following parameters:
- Run chart reference number
- Description
Once you have set the search parameters, click ‘Search’ button. The system displays the following details of the matching run charts.
- Run chart reference number
- Description
2.3.2 Starting Replay of Recorded Actions
You can start the replay of a recording based on a run chart using ‘Replay’ screen. To invoke this screen, type ‘STDOFARP’ in the field at the top right corner of the application toolbar and click the adjoining arrow button.
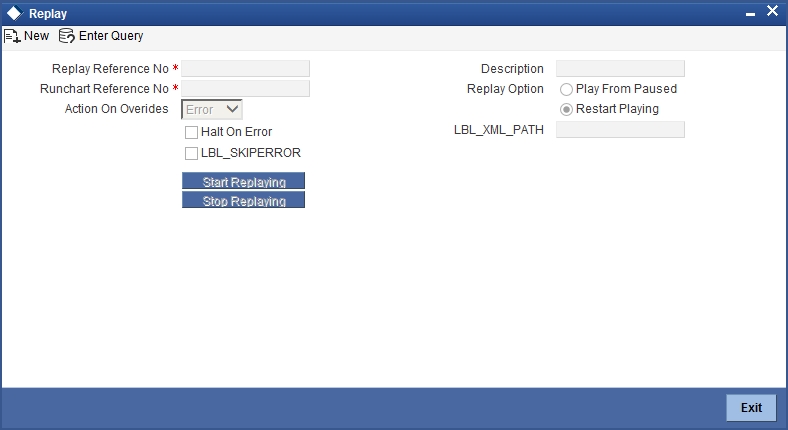
Specify the following details:
Replay Reference Number
The system generates and displays the reference number. You can use this later to identify the replay.
Run Chart Reference Number
Specify the run chart reference number for which you need to start the replay. The system will replay the recorded messages selected in the run chart number.
Replay Option
Specify whether you need to continue the replay from the last point or restart it.
- Play from paused - If you select this, the system will resume the replay from the point where it was stopped, when you click the ‘Start Replaying’ button.
- Restart Playing - If you select this, the system restart the replay, irrespective of whether it was stopped in the middle of a session, when you click the ‘Start Replaying’ button.
Action Overrides
Specify the action to be taken when an override occurs.
- Ignore - Select this to ignore the override and proceed with replay
- Error - Select this to stop the replay in case of override
Halt on Error
Check this box to halt the replay in case of an error.
Once you have specified the above details, click ‘Start Replaying’ button to begin the replay of the recording. You can stop the replay anytime by clicking ‘Stop Replaying’ button.
2.3.3 Viewing Replay Summary
You can view a summary of the replays using ‘Replay Summary’ screen. To invoke this screen, type ‘STSOFARP’ in the field at the top right corner of the application toolbar and click the adjoining arrow button.

You can search for the screens based on one or more of the following parameters:
- Run chart reference number
- Replay reference number
- Action on overrides
- Halt on error
- Replay option
Once you have set the search parameters, click ‘Search’ button. The system displays the following details of the replays that match the search criteria.
- Run chart reference number
- Replay reference number
- Action on overrides
- Halt on error
- Replay option
- Status
2.3.4 Monitoring Replay
You can monitor the status of replays using ‘Replay Monitor’ screen. To invoke this screen, type ‘STDOFAMN’ in the field at the top right corner of the application toolbar and click the adjoining arrow button.

You can view the following details based on the for the replay:
Replay Reference Number
Specify the reference number of the replay whose details you need to monitor.
Run Chart Reference Number
The system displays the reference number.
Status
The system displays the status of the replay that you are monitoring.
Action on Overrides
The system displays the action set to be performed by the system in case of an override during replay.
Halt on Error
The system displays whether the replays will halt on error or not.
Replay Status
You can view the following details in this section:
- Total records
- Total records failed
- Total records succeeded
- Total records processed
- Total records in progress
Replay Details
You can view the following details:
- Message ID
- Replayed sequence number
- Function ID
- Replay result
- Error code
- PK values
- User
- Branch code
Click ‘Record XML’ button to view the xml details.

In this screen, you can view the request XML and response XML details, based on the message identification.
2.3.5 Replay Reports
The system generates the following reports before and after the replay session.
- Accounts Report
- Balance Sheet Report - Branch Wise
- Combined balance Sheet Report
- Customer Report
- GL Report - Branch Wise
- Trail balance Report - Branch Wise
You can use these reports to view and compare the status of the transactions before and after the replay.
The report that is generated after the replay also shows the differences before and after the replay of the recorded transactions.