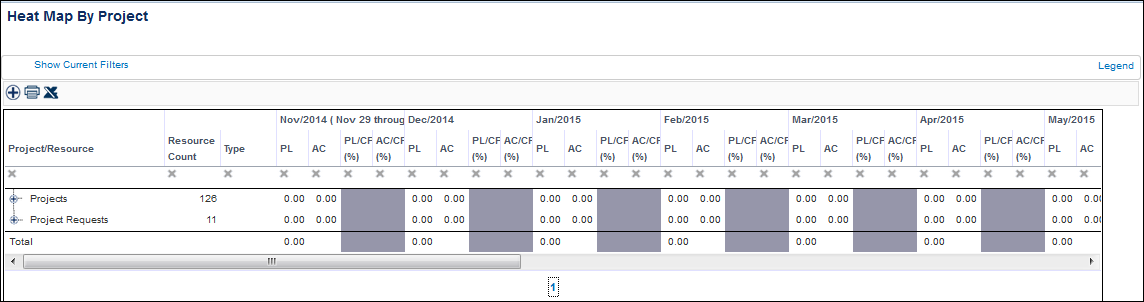
Based on your filters, this report displays a heat map by project. It displays the project/resource, resource count, planned effort for resources (PL), actual effort for resource (AC), planned utilization (PL/CP %), and the actual utilization (AC/CP %). For more information on the heat map thresholds used and a description of the column headers, click the Legend link. If your report has a cell highlighted in orange, it indicates that the committed effort as a percentage of capacity for the activity is in the mid range. If a cell is highlighted in red, it indicates that the activity's planned utilization is very high, and cells highlighted in green indicate very low utilization.
Filter Parameters
You can filter on pull down status, initiative, reporting date range, resource basics, resource filterable custom fields, resource organization hierarchy, project basics, project dates, project organization hierarchy, project finances, program, project custom fields, project classification fields, project alignment tree, proposal basics, proposal classification fields, proposal organization hierarchy, and proposal custom fields
Output Parameters
You can select the following filters:
- Display Filters: report format, maximum rows per report, rows per page, and hide rows with zero effect. The report format choice is HTML.
- Row Filters: display named resource, display TBD assignments, display projects, display proposals, display assigned allocations, display unassigned allocations, display activities, and display team/overhead.
- Column Filters: display project count, display capacity, display requested, display committed, display total demand, display percent allocations/approvals, display planned, display actual, and display percent utilization.
The report format choice is HTML.
Sample Report