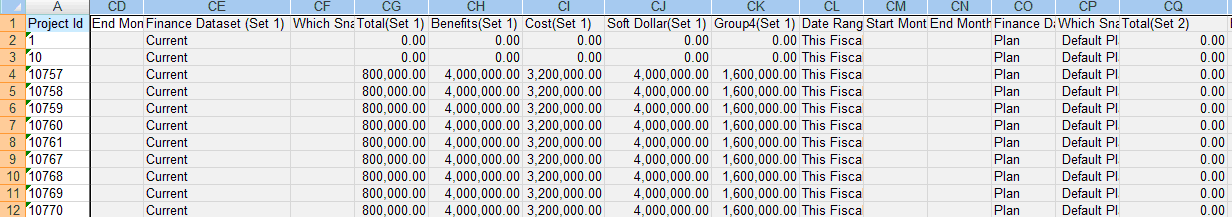
You can configure the three Finance Aggregate Reports with the use of a small set of filters to create a report output that is best suited to your needs. You can also use these reports as data sources to generate highly specific output in the form of Excel charts, pivot table and any company-style formatted output (See topic Creating User-Defined Excel Reports).
The four Finance Aggregate Reports provide increasing levels of detailed information. They also provide extensive columns of non-financial information about projects such as– organization, classification, users, custom fields, etc. The hierarchy of finance information can be visualized as:
Total
Group1
Category 1.1
Element 1.1.1
Total refers to the sum-total finance value of a Project. Group1, 2, 3, 4, 5 refers to the items in the Finance Template hierarchy you have configured just below the Total level. Categories are the items below Groups and Elements are the items below Categories.
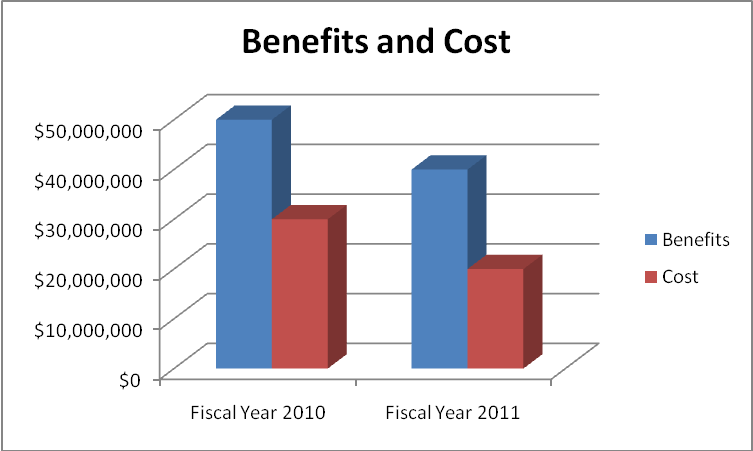
Sample Report
The sample below is an example of what you can do by using the data generated from the Finance Aggregate Reports as data sources to create custom generated user reports.