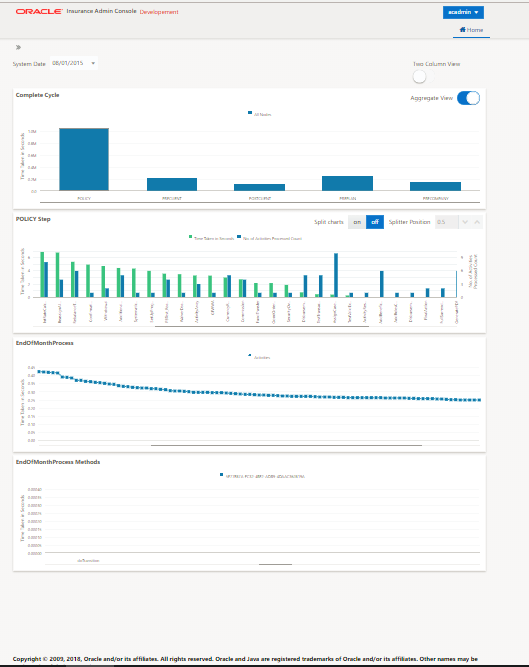
Complete Cycle Page
This page shows a composition of historical cycle charts, which represents an entire view of one OIPA cycles. The page displays the charts in two different views namely, a Single column view and a Two- column view.
Single Column View
Two - Column View

The user can view the following charts in the Complete Cycle Page:
- Chart 1 (Cycle Steps and Cycle Client Members) - Processing Time (Y-axis) Vs Cycle Processing Step (X-axis)
- Chart 2 (Activities Executed in a Cycle Step) - Processing Time (Y-axis) Vs Activities (X-axis)
- Chart 3 (The Individual Activities with the Same Name) - Processing Time (Y-axis) Vs Policy numbers for Policy cycle step, Client name for Client cycle steps and Activity GUID for Plan and Company cycle steps (X-axis)
- Chart 4 (The Methods that were Executed within an Activity) - Processing Time (Y-axis) Vs Activity methods (X-axis)
