System Resource Utilization Statistics for UI
The system resource utilization (JVM utilization) statistics for all the servers obtained for OIPA UI load tests are given below:
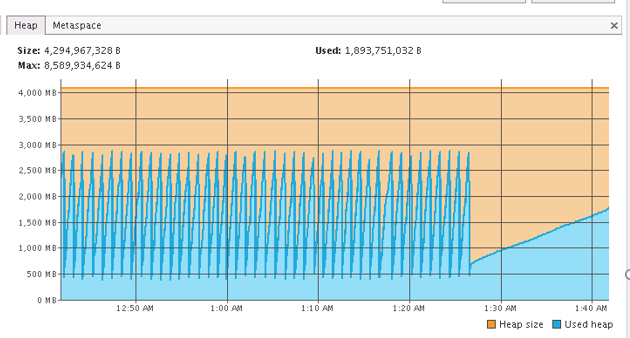
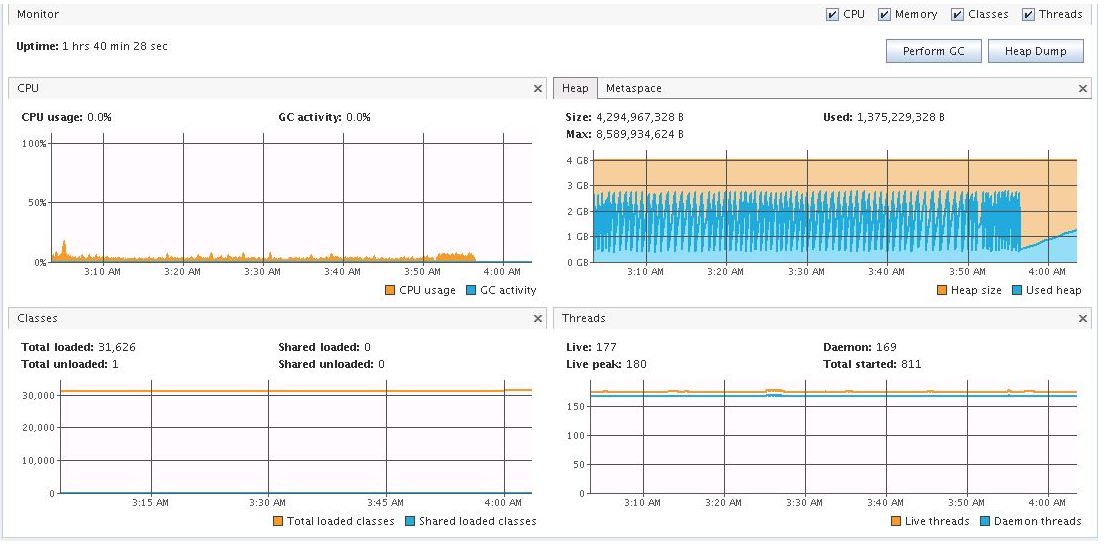
Heap Utilization
The heap usage for each instance is between 1 GB and 3 GB out of 4GB allocation. Frequent minor GC’s are happening as expected to reclaim young gen memory and decent major GC’s are also happening to reclaim old gen memory. There is no instance of Out of Memory issues at all.
Application Servers
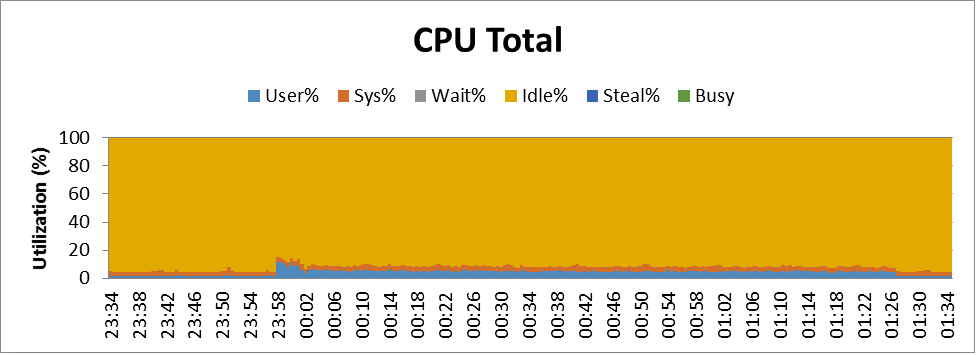
Application Server1 CPU Utilization - Average – 7.65%, Max – 10.2%
Below is the graph that shows the CPU utilization of Application Server1. 7.65 % average utilization has been recorded and went up to 10.2% of maximum utilization.
App Server1 Network Utilization
Below is the graph that shows Network utilization of Application Srever1. It can be observed that a series of network reads and writes during the application transaction processing. The average reads are below 862.2 kb/s and the average writes are below 328.1 kb/s. This indicates the network I/O is decent.

Application Tier
Both the JVM memory and CPU on the application server are utilized efficiently. Tuning of application properties as specified above, gave optimal performance.
Database Servers
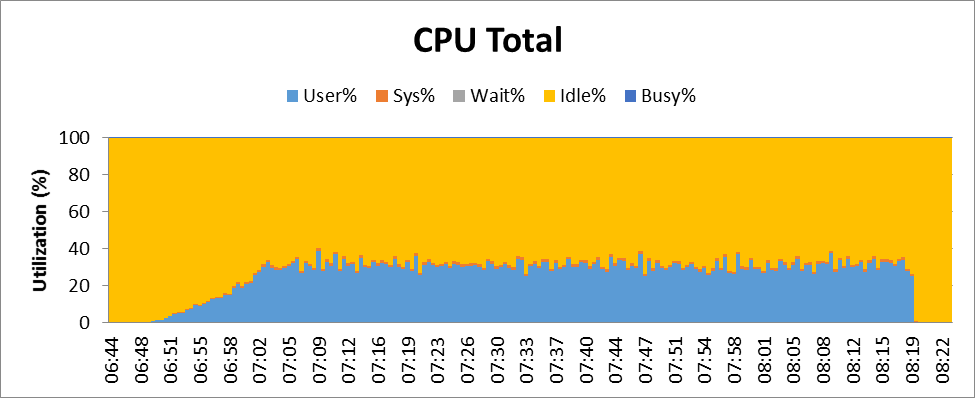
DB Server CPU Utilization - Average – 26.55 %, Max – 40.4%
Below is the graph that shows CPU utilization of a DB server. 26.55 % average utilization has been recorded and went up to 40.4% of maximum utilization.
DB Server Network Utilization
Below is the graph that shows network utilization of a DB server. It can be observed that a series of network reads and writes during the application transaction processing. The average reads are below 201.7 kb/s and the average writes are below 902.1 kb/s. This indicates the network I/O is decent.