Using the Absence Analytics Dashboard Pagelets
The Absence Analytics Dashboard enables administrators to quickly analyze absence and payroll results using a variety of pivot grid pagelets. The user determines which pivot grid pagelets appear on the dashboard and how they are laid out on the page.
The system loads absence analytics data for individual calendar groups as part of the absence and payroll calculation process (GP_PAYE). You can also use the Load Absence Analytics Data Page to load absence analytics data for existing calendar groups within a given date range.
Accessing the Absence Analytics Dashboard
You can access the Absence Analytics Dashboard using the classic navigation, , or the Absence Analytics Dashboard Tile.
Delivered Learning Home Pagelets
The following pagelets are delivered for the Absence Analytics Dashboard.
|
Pagelet |
Usage |
|---|---|
|
Analyze the cost of reported absences by absence type, absence take, and absence reason. |
|
|
Analyze absence entries by status, absence type, absence take, and absence reason. |
|
|
Analyze the absence liability for all absence entitlements by period begin date. |
|
|
Analyze absence entries by employee engagement factors such as absence rate for a business entity as of a specific date, absence rate for a given period, total number of absence days, average absence duration, and average absence days. |
|
|
Analyze absence results by absence take and absence type. |
|
|
Analyze absence results associated with negative balances. |
|
|
Analyze absence results that include unpaid and partially paid absences. |
|
|
Analyze absence results associated with generated positive input. |
|
Field or Control |
Definition |
|---|---|
 Pagelet
Settings Pagelet
Settings |
Click the Page Settings icon to access the pagelet settings. Values are:
|
 Refresh
Pagelet Refresh
Pagelet |
Click the Refresh Pagelet icon to refresh the contents of the pagelet. |
 Options
Menu Options
Menu |
Click to open the Options Menu and select an action to perform on the pivot grid or chart. Available actions are:
|
| Filters |
Displays the filtering fields that are selected in the chart options. Users can use the available filters to change the data to be displayed in the pivot grid or chart. |
    Pivot
Grid Chart Types Pivot
Grid Chart Types |
Click to display data in the chart type represented by the icon. Available chart types include vertical bar, line, pie and horizontal bar. |
For more information on pivot grid functionality, see the product documentation for PeopleTools: Pivot Grid.
Use the Absence Analytics Dashboard tile (HC_GP_WC_ABS_ANLTC_FLU_GBL) to access the Absence Analytics Dashboard.
Navigation
You can add the delivered Absence Analytics Dashboard tile to your fluid home pages.
Image: Absence Analytics Dashboard tile
This example illustrates the Approvals tile.
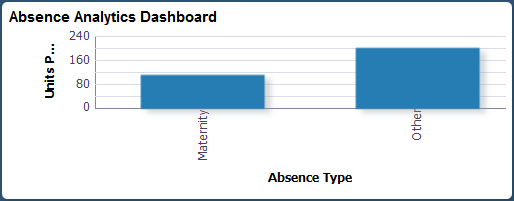
The tile displays a bar chart of the units per absence event by absence type. Click it to access the Absence Analytics dashboard in the classic user interface.
Use the Absence Cost Analysis pagelet to analyze the cost of reported absences by absence type, absence take, and absence reason.
Image: Absence Cost Analysis pagelet
This example illustrates the fields and controls on the Absence Cost Analysis pagelet.
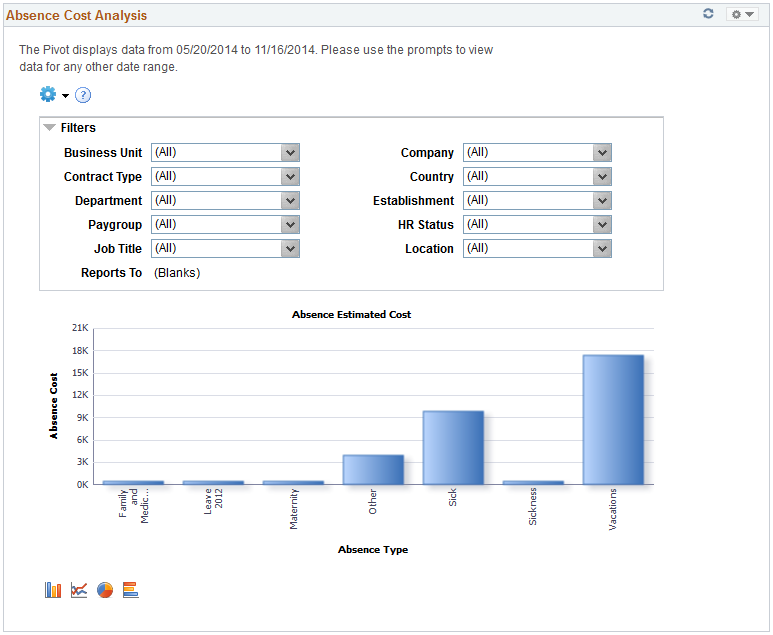
By default this pivot grid displays a bar chart of the total absence cost for the specified date range by absence type.
Examples of what administrators can use this pivot grid to determine are:
The amount that paid employee absences have cost the company for a given date range.
What costs were incurred by the company for a specific team across different locations.
The variation in absence costs over different pay calendars for a given date range.
Use the Absence Events Analysis pagelet to analyze absence entries by status, absence type, absence take, and absence reason.
Image: Absence Events Analysis pagelet
This example illustrates the fields and controls on the Absence Events Analysis pagelet.
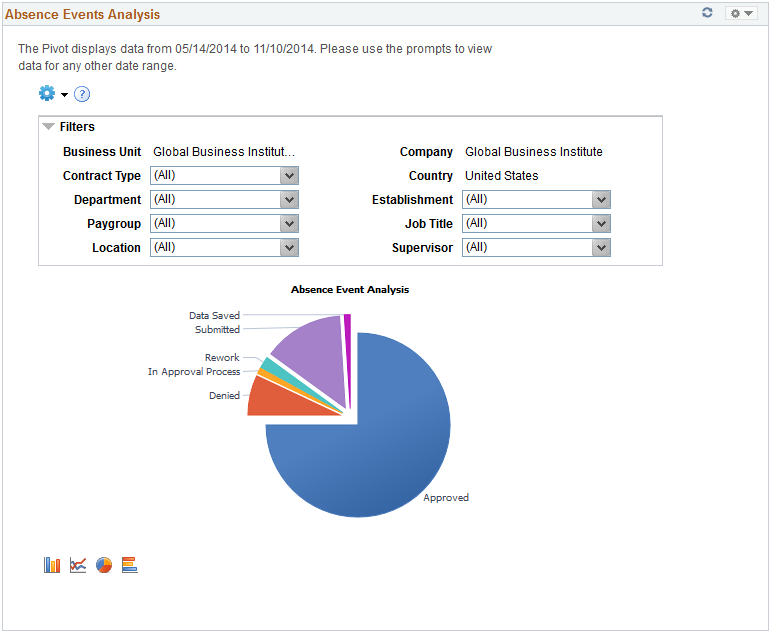
By default, this pivot grid displays a pie chart of the absences for the administrator’s company for the specified date range by approval status.
Note: When a manager accesses this pivot grid through the Manager Dashboard or through the PeopleSoft Fluid User Interface, it displays a bar chart of the absences by approval status for the employees who report to the manager.
Examples of what administrators can use this pivot grid to determine are:
The number of absences pending approval, and the employees with which they are associated.
The number of absence requests entered for a given pay period.
The types of absence requests that employees and direct reports are entering.
Which employees reported absences with partial hours or partial days.
The counts of absence entry composition by entry source.
Related Actions
You can click an area of the chart and select Detailed View to view the absence event data using the Pivot Grid Drilldown page.
Image: Pivot Grid Drilldown page
This example illustrates the fields and controls on the Pivot Grid Drilldown page.
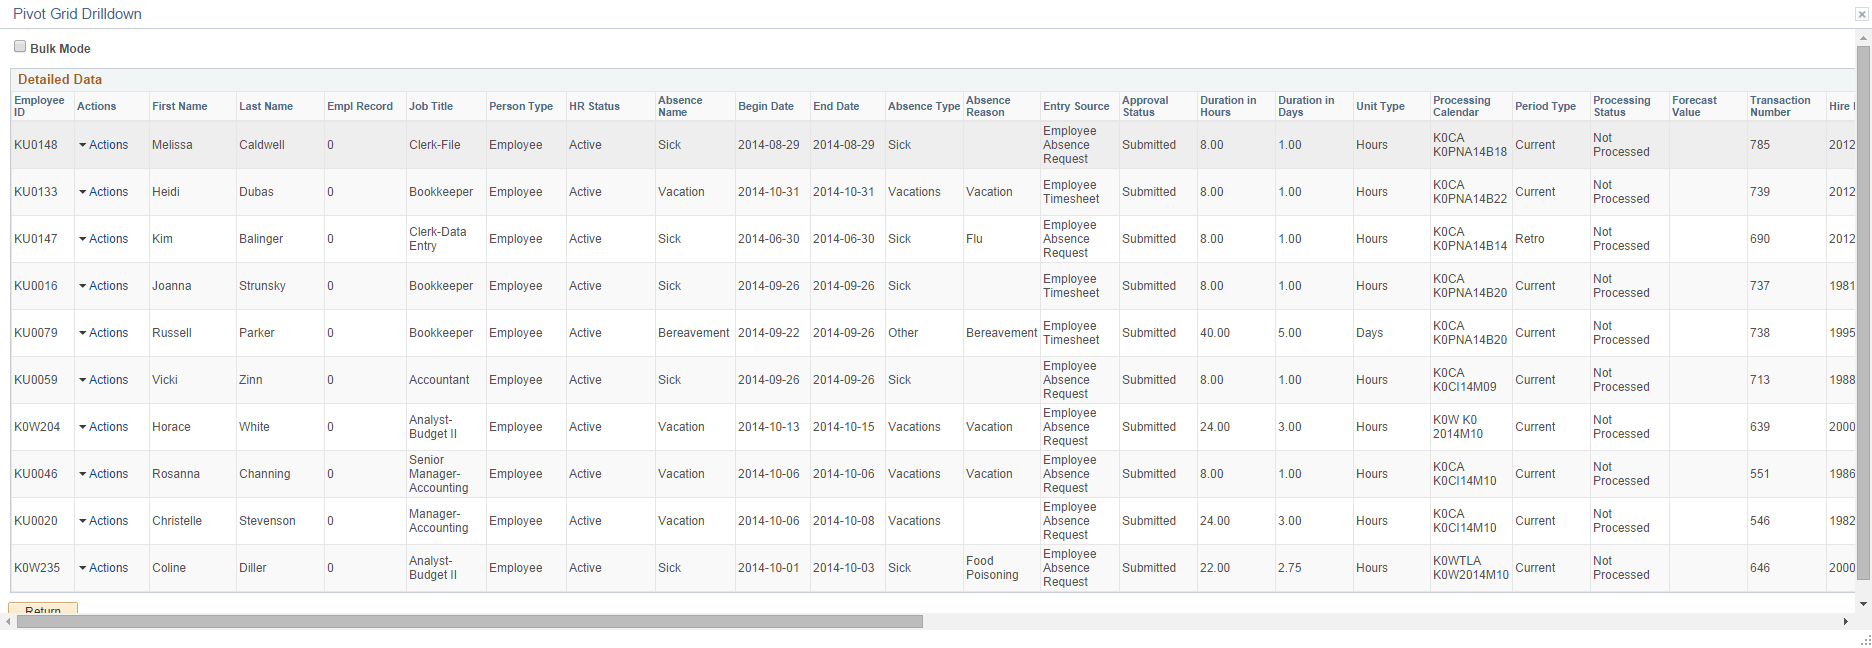
|
Field or Control |
Definition |
|---|---|
| Actions |
Click to access the available related actions for the absence request. Valid values are:
|
Use the Absence Liability and Trends pagelet to analyze the absence liability for all absence entitlements by period begin date.
Image: Absence Liability and Trends pagelet
This example illustrates the fields and controls on the Absence Liability and Trends pagelet.
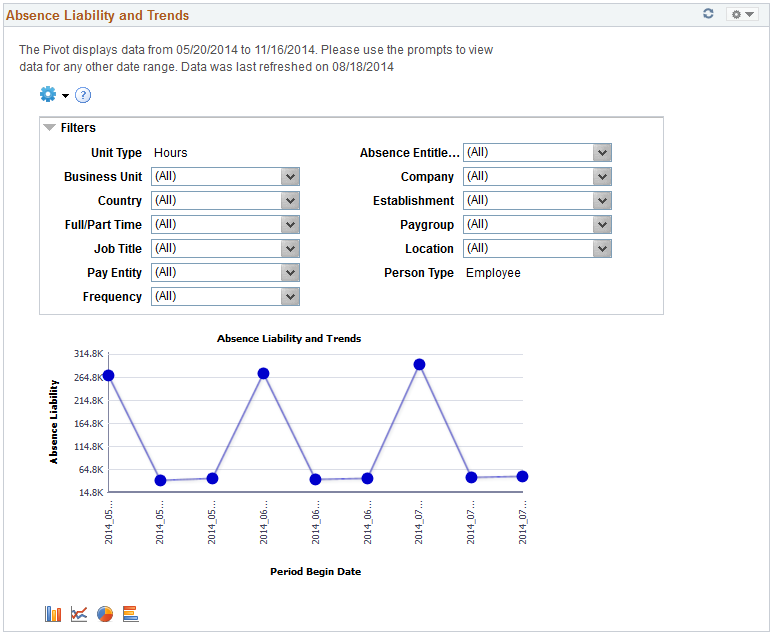
By default, this pivot grid displays a line chart of total absence liability for the specified date range by period begin date.
Examples of what administrators can use this pivot grid to determine are:
The current liability for a given pay period.
The current year-to-date absence liability for a specific business unit.
The trends for reported absences and accrual balances for a given pay period.
Use the Periodic Absence Rate pagelet to analyze absence entries by employee engagement factors such as absence rate for a business entity as of a specific date, absence rate for a given period, total number of absence days, average absence duration, and average absence days.
Image: Periodic Absence Rate pagelet
This example illustrates the fields and controls on the Periodic Absence Rate pagelet.
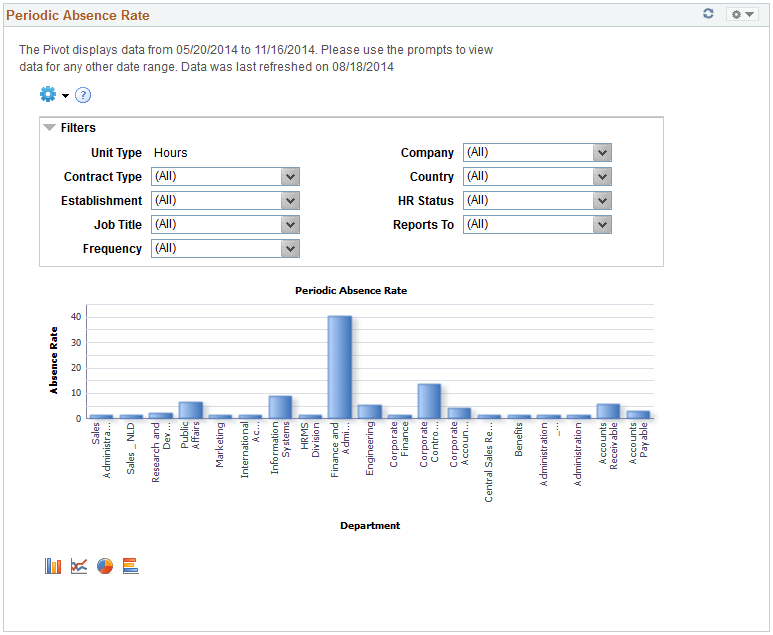
By default, this pivot grid displays a bar chart of the overall absence rate in hours for the specified date range by department. The absence rate is defined as the working time lost divided by the working time available, multiplied by 100.
Examples of what administrators can use this pivot grid to determine are:
The absence rate for a business unit for a given date range.
The average absence rate across an organizational entity.
Use the Absence by Take and Type pagelet to analyze absence results by absence take and absence type.
Image: Absence by Take and Type pagelet
This example illustrates the fields and controls on the Absence by Take and Type pagelet.
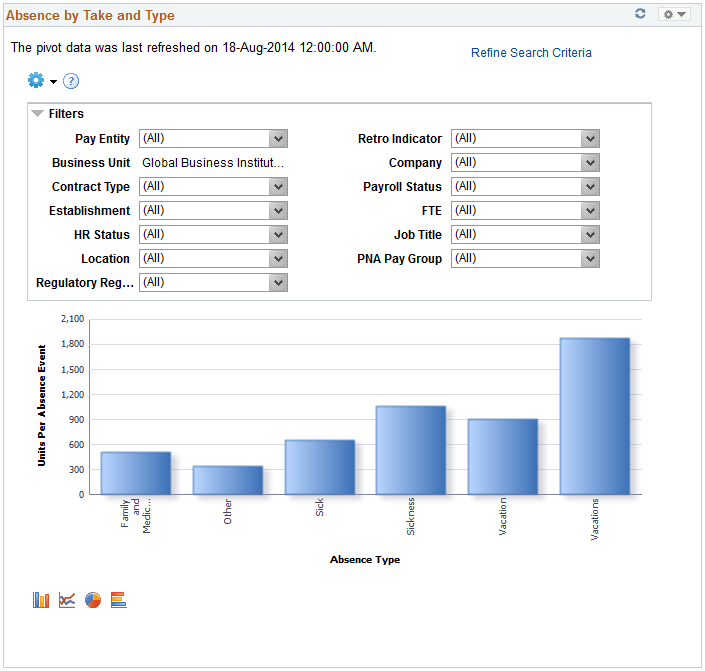
By default, this pivot grid displays a bar chart of the units per absence event by absence type.
Examples of what administrators can use this pivot grid to determine are:
The amount of sick leave taken reported by a specific department.
The amount of work-related absences for a specific calendar group.
|
Field or Control |
Definition |
|---|---|
| Refine Search Criteria |
By default, the pivot grid displays all the absence analytics data that you have loaded in your system. Click this link to access the Refine Search Criteria modal page, which enables you to analyze a smaller, refined set of data. After entering your search criteria, click Run to apply them. Click Save Criteria and Run if you want the system to apply these search criteria the next time you access the pivot grid. |
Use the Employee with Negative Balance pagelet to analyze absence results associated with negative balances.
Image: Employee with Negative Balance pagelet
This example illustrates the fields and controls on the Employee with Negative Balance pagelet.
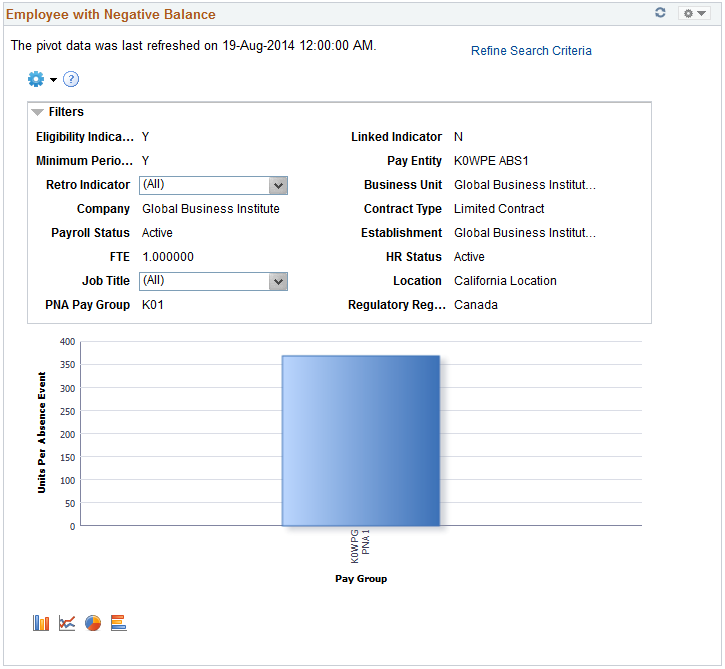
By default, this pivot grid displays a bar chart of the units per absence event by pay group.
Examples of what administrators can use this pivot grid to determine are:
The number of employees paid for absences using a negative balance limit.
The amount of absences paid using a negative balance limit for a specific absence type.
|
Field or Control |
Definition |
|---|---|
| Refine Search Criteria |
By default, the pivot grid displays all the absence analytics data that you have loaded in your system. Click this link to access the Refine Search Criteria modal page, which enables you to analyze a smaller, refined set of data. After entering your search criteria, click Run to apply them. Click Save Criteria and Run if you want the system to apply these search criteria the next time you access the pivot grid. |
Use the Absence by Paid Unpaid Status pagelet to analyze absence results that include unpaid and partially paid absences.
Image: Absence by Paid Unpaid Status pagelet
This example illustrates the fields and controls on the Absence by Paid Unpaid Status pagelet.
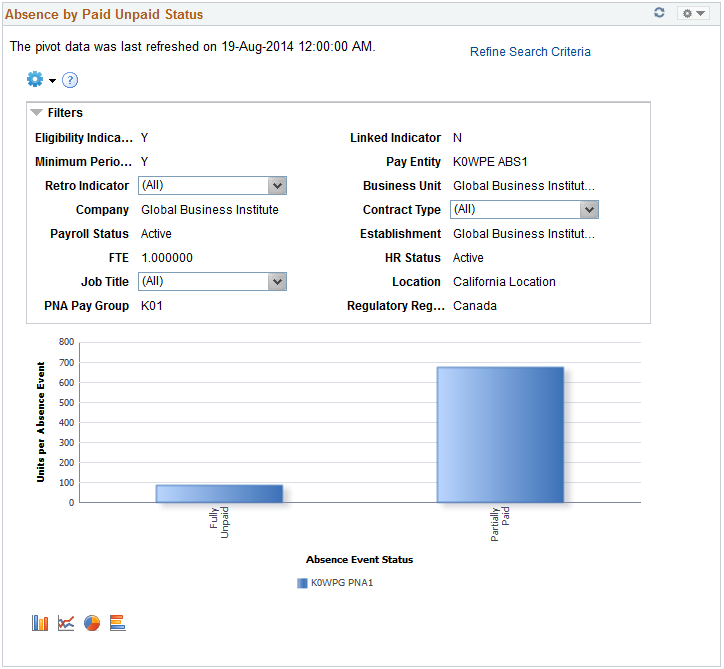
By default, this pivot grid displays a bar chart of the units per absence event by absence event status and pay group.
Examples of what administrators can use this pivot grid to determine are:
Identify employees with absences that have an unpaid or partially paid status.
View absence event status for a pay group by absence type.
|
Field or Control |
Definition |
|---|---|
| Refine Search Criteria |
By default, the pivot grid displays all the absence analytics data that you have loaded in your system. Click this link to access the Refine Search Criteria modal page, which enables you to analyze a smaller, refined set of data. After entering your search criteria, click Run to apply them. Click Save Criteria and Run if you want the system to apply these search criteria the next time you access the pivot grid. |
Use the By Generated Positive Input pagelet to Analyze absence results associated with generated positive input.
Image: By Generated Positive Input pagelet
This example illustrates the fields and controls on the By Generated Positive Input pagelet.
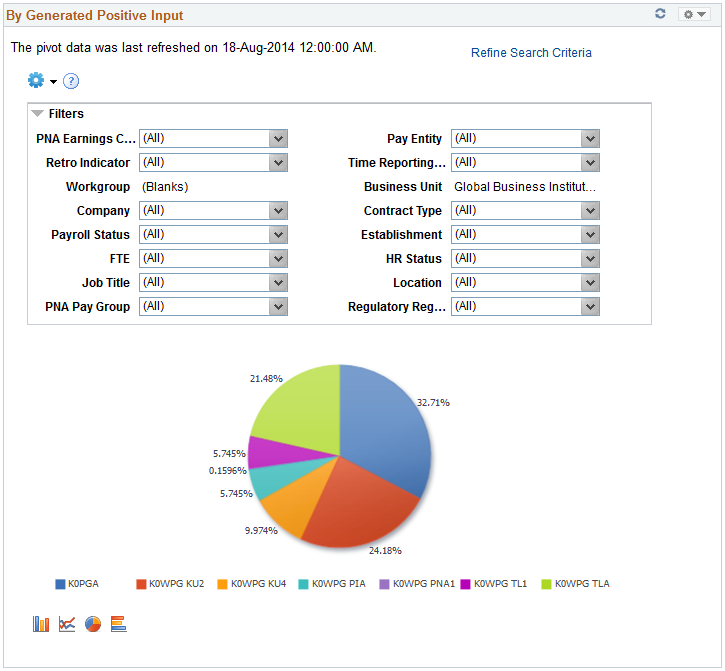
By default, this pivot grid displays a pie chart displaying the percentages of units per absence event by pay group.
|
Field or Control |
Definition |
|---|---|
| Refine Search Criteria |
By default, the pivot grid displays all the absence analytics data that you have loaded in your system. Click this link to access the Refine Search Criteria modal page, which enables you to analyze a smaller, refined set of data. After entering your search criteria, click Run to apply them. Click Save Criteria and Run if you want the system to apply these search criteria the next time you access the pivot grid. |