Session Reports
The Sessions Report is a SIP session summary of all logged call sessions on the Oracle Enterprise Communications Broker (OECB). When Lightweight Directory Access Protocol (LDAP) is enabled on the Active Directory, LDAP session messages may also display.
The columns that display on the Sessions Report page depend on the columns that you specified in the "Customizing the Page Display" procedure.
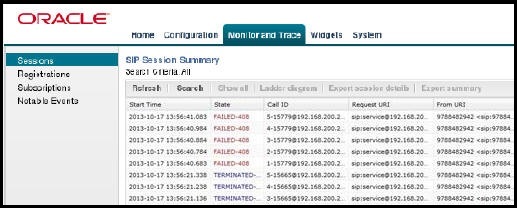
The following table describes the columns on the SIP Session Summary page.
| Start Time | Timestamp of the first SIP message in the call session. |
| State | Status of the call or media session. Valid values
are:
INITIAL—Session for which an INVITE or SUBSCRIBE was forwarded. EARLY—Session that received the first provisional response (1xx other than 100). ESTABLISHED—Session for which a success (2xx) response was received. TERMINATED—Session that ended by receiving or sending a BYE for an “Established” session or forwarding an error response for an “Initial” or "Early" session. The session remains in the terminated state until all the resources for the session are freed up. FAILED—Session that failed due to a 4xx or 5xx error code. |
| Call ID | Identification of the call source. Includes the phone number and source IP address. |
| Request URI | Uniform Resource Identifier (URI) formatted string that identifies a resource by way of a protocol, name, location, and any other applicable characteristic that is sent by the OECB in REQUEST headers. |
| From URI | URI formatted string that identifies the call source information. |
| To URI | URI formatted string that identifies the call destination information. |
| Duration | Amount of time, in seconds, that the call or media event was active. |
| Notable Event | Indicates if a notable event has occurred on the
call session. Valid values are:
short session—Sessions that do not meet a minimum configurable duration threshold. Session dialogue, captured media information, and termination signalling. Any event flagged as a short session interesting event. local rejection—Sessions locally rejected at the OECB for any reason, for example, Session Agent (SA) unavailable, no route found, SIP signalling error, and so on. Session dialogue, capture media information, and termination signalling. Any event flagged as a local rejection interesting event. |
| Session ID | Identification assigned to the call session. |
| Ingress Src Addr | Source IP address of the incoming call or media event. |
| Egress Dest Addr | Destination IP address of the outgoing call or media event. |
The following table describes the controls on the SIP Session Summary page.
| Search | Use to specify parameters for performing a search for specific session summary records within the current report. |
| Show all | Use to display all of the session summary records in the Sessions Report. |
| Ladder Diagram | Use to display a Ladder Diagram of a specific record in the table. The Ladder Diagram displays detailed information about a call session or media event. |
| Export Session Details | Use to export the SIP messages and media events associated with the selected session to a file in text format on the local machine. |
| Export Summary | Use to export all logged session summary records to a file in text format on the local machine. |
Display a Sessions Report
Ladder Diagram
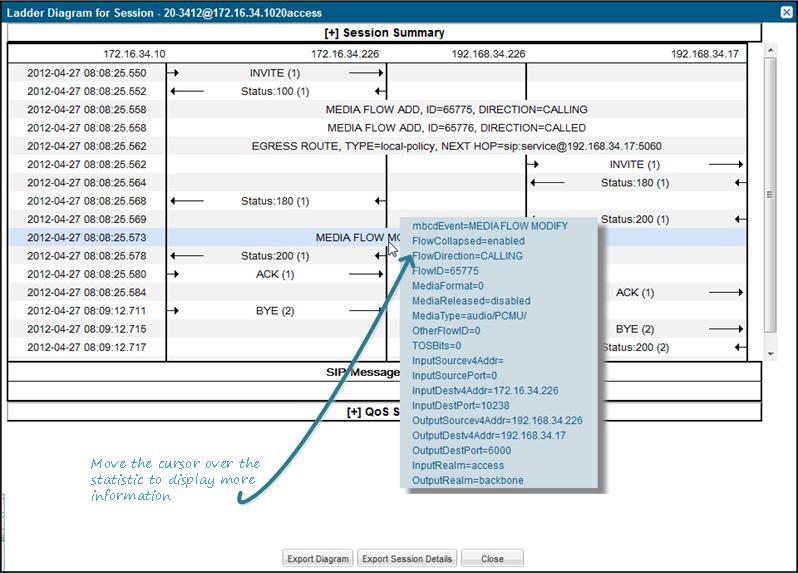
A ladder diagram in the Web GUI schematic that shows the call and media flow of packets on ingress and egress routes by way of the Oracle Enterprise Communications Broker.
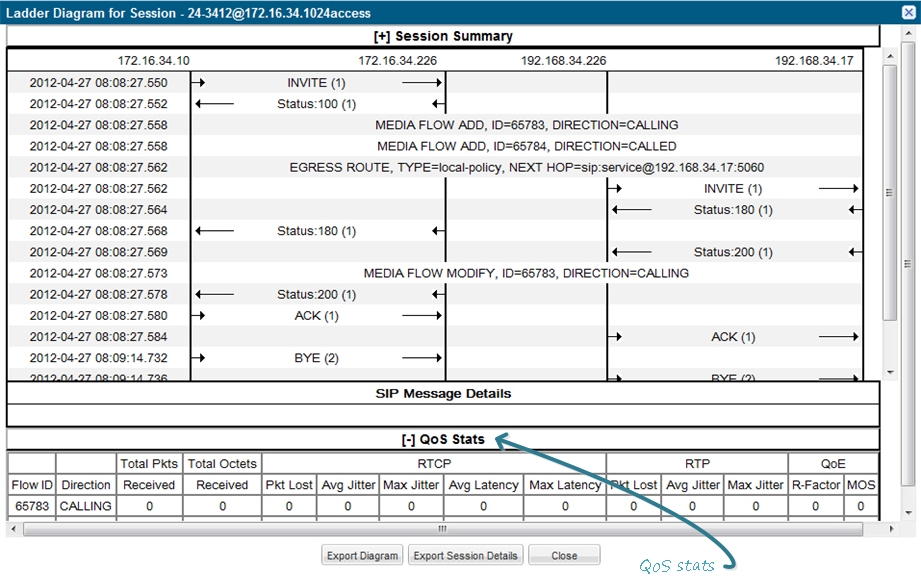
A ladder diagram for the Sessions Report displays the following session summary information:
- Quality of Service (QoS) statistics for call sessions
- SIP messages and media events in time sequence
To display a ladder diagram for a specific record in the Sessions Report, click a record in the summary table or click Ladder diagram on the SIP Sessions Summary page.
Session Summary
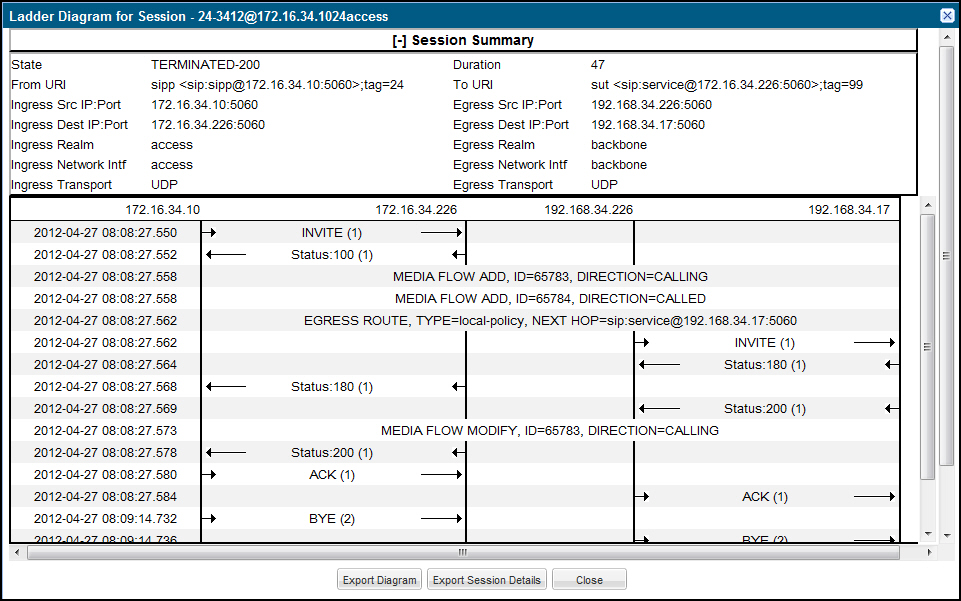
The Session Summary window in the Ladder Diagram displays an overall summary of the call or media session in focus.
SIP Message Details
The SIP Message Detail window displays detailed information and data flow (ingress and egress) about the call or media event.
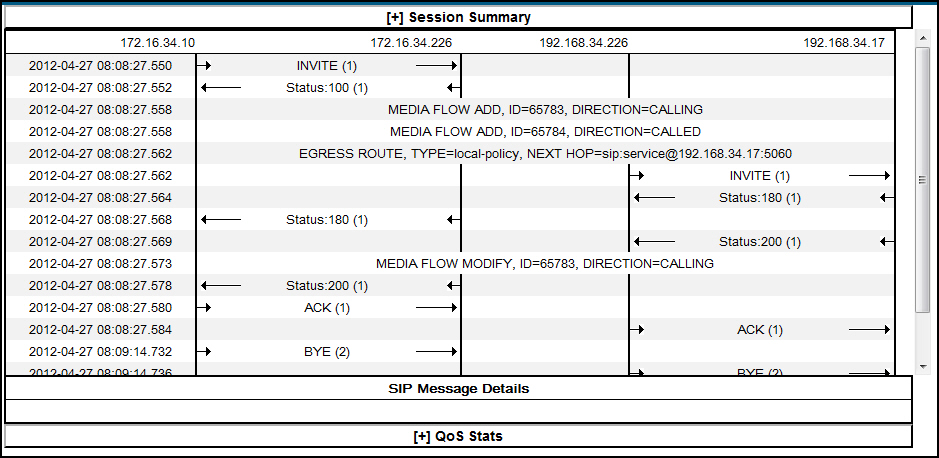
When a session is routed using the a Lightweight Directory Access Protocol (LDAP) configuration (Active Directory) for the local policy, the LDAP information displays in the Session Summary window. The next hop value containing "enum:…" or "dns:…" displays. Similarly, the next hop value "ldap:…" displays for LDAP queries.
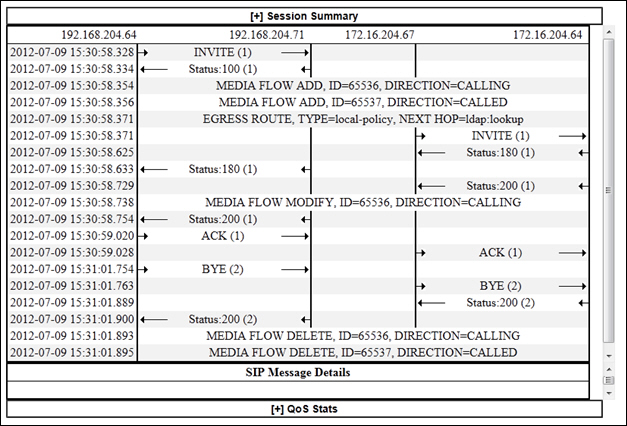
Display SIP Message Details
To display SIP Message Details:
- On the Sessions Report page, click Ladder diagram, or select a record in the table and double-click on that record. The SIP Message Details window displays. This window displays the messages and status codes that occurred during the active call session or media event. You can use the information to troubleshoot calls and media events that failed or timed out when trying to connect.
