| Oracle® Retail Science Cloud Services Implementation Guide Release 19.1.003.2 F40917-01 |
|

 Previous |
 Next |
| Oracle® Retail Science Cloud Services Implementation Guide Release 19.1.003.2 F40917-01 |
|
Previous |
Next |
This chapter describes the Assortment and Space Optimization application.
Assortment and Space Optimization (ASO) is used to determine the optimal selection and arrangement of products within stores by optimizing the product assortment and product placement on a planogram. ASO uses information about available space in stores, product dimensions, fixture configurations, expected demand and demand transference, replenishment schedules, target service levels, merchandising rules, visual guidelines, and category goals to create VPOGs that optimize total performance. In short, ASO generates space-informed optimal product assortments in the form of a virtual planogram. (A VPOG is ASO's assortment recommendations in product facings, depth, stacking, and SKU order in form of a planogram.)
The products that are selected for the VPOGs are the ones that ASO recommends for the finalized assortment. The recommended product level data is used inside CMPO, while the virtual planograms created in ASO are available for use in space planning applications. Figure 9-1 shows the flow of an assortment through ASO.
ASO supports store level and space cluster level optimizations runs. Space clusters are ad-hoc groups of stores used for optimization. Each space cluster includes stores that are in the same assortment, have the same product list, and have the same current planogram length (or same planogram length, depth, height, and fixture type, if additional planogram attributes are selected). Space clusters are a level between assortment cluster and store. ASO creates space clusters by partitioning stores from an assortment cluster into smaller groups of stores that have the same product list and planogram attributes. In a store level optimization run, each store is optimized independently using the store's specific data to generate one optimal planogram for each store. On the other hand, in a space cluster-level optimization run, every space cluster is optimized independently, using aggregated store data to produce one optimal planogram for each space cluster.
ASO supports shelves, pegboards, freezer chests, and a combination of shelf and peg-board planogram fixture types. The smart start process in ASO creates fixture details using a combination of default values and user selection and assigns shelves to the base fixture of the fixture profile.At a high level, ASO starts with an assortment that is ready for optimization. The assortment is mapped to one or more planograms and one or more optimization runs. Approved runs are then available for assortment analysis and can then be finalized and exported.
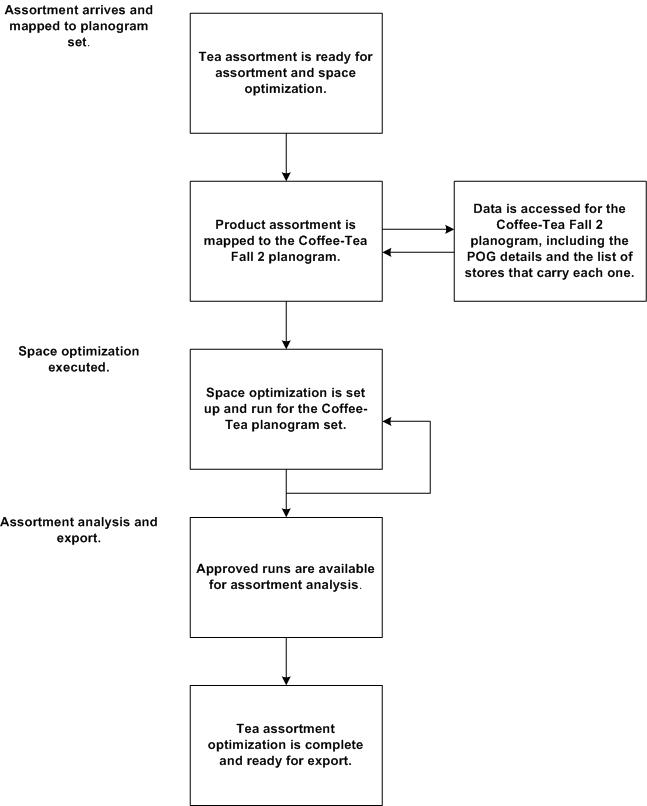
Figure 9-2 shows an overview of ASO workflow, which is described here:
Receive Assortment: ASO receives a preliminary assortment list from CMPO that is to be space optimized. The assortment is mapped to a set of available planograms through assortment-to-planogram mapping files.
Set up Optimization: Allows users to specify the location level for the optimization, select planogram and optimization locations, select or update available fixture configurations, view or modify product merchandising options, and demand and replenishment data. Note that the majority of this information is pre-loaded into the solution.
Assortment and Merchandising Rules: Allows users to specify visual blocking and sorting rules, product and planogram constraints, assortment rules like the list of products that must be kept together, pick at least three from a list of five products, and so on. Note that mandatory items from CMPO are automatically available here.
Analyze Optimized Space and Assortment: Allows users to view and analyze optimized assortment and associated facings recommendations as well as a visualization of the optimized POG. The user can also review KPIs such as optimized service levels, expected sales, and profit.
Finalize Cluster and Store Virtual POG: Allows users to interact with VPOG and override recommendations before finalizing and approving optimized assortments.
This section provides information about setting up the data that the ASO application uses to generate optimal product assortment and placement on virtual planograms. See Oracle Retail Science Cloud Services Implementation Guide for detailed file formats and definitions.
ASO requires product assortment data that contains information about assortments, assortment clusters and products within an assortment cluster, placeholder product information, like-items for placeholder products, price, cost, and forecast data for products in the assortment.
Note that this section does not discuss the assortment files related to placeholder attributes, finalized assortment placeholder products, or assortment finalization data.
Here is a list of the assortment data files.
Assortment staging file: This file specifies the assortment header and general information about the assortment, including assortment goal.
Assortment cluster file: This file provides information on assortment clusters.
Assortment cluster membership file: This file contains information on stores to assortment cluster assignments.
Assortment product store/cluster file: This file defines the list of products (including placeholder products) for a given assortment and store/assortment-cluster combination. It also contains the IPI and product priority indices.
Assortment product location forecast file: This file contains the weekly forecast for a list of products (including placeholder products) for a given assortment and store/assortment-cluster combination.
Assortment product location price and cost file: This file provides the regular retail price and the cost for the list of products (including placeholder products) for a given assortment and store/assortment-cluster combination.
Assortment placeholder product like product file: This file contains the list of placeholder products and a like product for each placeholder product in the assortment. ASO uses the like product information available in the file to extract product size data, product attributes, and replenishment data.
ASO requires planogram (POG) data that is used to define POG dimensions, categories, seasonal information, and product display geometry. CMPO provides ASO with the files it requires. Thus, CMPO customers can export POG data to files that ASO can import readily. Customers who use another POG or space planning solution must provide POG data to meet the ASO interface definitions.
The following POG files are needed for ASO.
POG definition file: This file defines the major characteristics of a POG, including name, category, status, season, and dimensions.
POG store file: This file maps a POG to a particular store or a set of stores.
POG display style file: This file lists the display styles used in certain planograms.
Product display style orientation file: This file is a cross reference between display styles and orientation. This lists the valid orientations for each display style. It is required that each display style must be mapped to at least one orientation.
POG bay configuration file: This file provides a list of bays used by the POG.
Fixture definition file: This file provides a list of the fixtures that define the POG. Fixture attributes specific to pegboards and freezer chests are also defined in this file.
Fixture configuration file: This file describes the fixture layout in a bay. A fixture can be a shelf, pegboard, or freezer chest.
Display style compatibility file: The file cross references fixture types and display styles. It lists the fixtures for which the display style is valid.
Shelf definition file: This file is required for shelf fixture planograms. It provides the details for each individual shelf in the fixture.
Shelf configuration file: This file describes the shelf layout in a fixture.
Product display style file: This file specifies product to display style mappings. It provides a list of display styles that are available for a specific product.
Display style definition file: This file provides the display style product settings and dimensions.
Shelf product configuration file: This file describes the product layout on the shelf fixture.
Pegboard/freezer product configuration file: This file describes the product layout on the pegboard/freezer fixture.
Store custom attributes: This file provides user-defined POG attributes for every store/POG.
It is recommended that, at implementation time, planogram data is imported in bulk rather than on ad-hoc basis. Additional planogram data can be loaded incrementally.
A partially automated process in ASO attempts to map assortments to planograms. The process matches the seasons associated with planograms and assortments and considers demand spread factors for products in assortments that are assigned to multiple planograms at one time. The user can achieve the desired mappings by creating or editing a pair of mapping files. The assortment-to-planogram mapping files must be created before either of the two components can be used in ASO. Introduction of new assortments or planograms mandates the update and load of new mapping files before using the new assortments or planograms in ASO.
Here is the list of mapping files.
POG to assortment mapping file: This file contains the POG hierarchy to assortment product mapping information, and it is used to identify which POG should be used for each product in the assortment.
POG season-to-assortment mapping file: This file contains the POG season-to-assortment date mapping. Once the mapping from product to POG has been performed, a second pass examines this table to identify the specific season for the POG to use based on the assortment start date.
The assortment to POG mapping process has two main components. An automated mapping process assigns assortments from APO to POG sets. Afterwards the mapping, the user can access a UI to review and potentially override the mapping results.
The following data is input for the mapping process.
APO assortment, with associated data (SO_ASSORTMENT_STG)
Product list from APO assortment, at either the store level or the cluster level (SO_ASSORT_PRODUCT_STRCLTR_STG)
Stores within the assortment clusters, including effective assortment dates (SO_ASSORT_CLUSTER_STG and SO_ASSORT_CLUSTER_MEMBER_STG)
Historical POG data, including POG hierarchy information (that is, POG department, POG category, POG sub-category) and POG seasonal attributes (SO_POG_STG)
Store to POG data. List of stores that have each POG, along with the effective dates for the POG at the store level (SO_POG_STORE_STG)
Mapping tables
Product to POG node mapping table (SO_POG_ASSORT_MAPPING_STG)
Seasonal attribute mapping table (SO_POG_ASSORT_SEAS_MAPPING_STG)
Merchandise hierarchy (Core data provided separately)
The automated process consists of the following steps:
Find one or more POG set(s) for each product.
The process iterates through the list of products associated with each cluster or store (depending on the assortment level) and performs a lookup to identify a POG node and demand spread factor for each product.
ASO searches the mapping tables for the lowest level merchandise hierarchy node that matches that product, starting at the product level, then, if the mapping is not there, looks for the product's parent, the product's grandparent, and so on. The highest level for escalation is the assortment's product category.
Exception case: If no matching row for the product (or ancestors) is found in the mapping table, the product will be considered unmapped and will be handled manually via the UI. Nothing else is done for that product by the automated process.
Find the seasonal attribute.
For each location within the assortment cluster and mapped POG node found for the products above, ASO performs a year-independent lookup for the seasonal attribute using the location's start date against the season's provided in the mapping tables. If no match is found, the process will use the current season. Current season is defined as the one that corresponds to the POG with the latest (most recent) effective_start date for any loaded POG within the POG node.
Find a POG for each one of the stores in the assortment cluster associated with the product. Stores within the same assortment clusters will very likely have different POGs assigned to them. This steps finds those POGs
If a season is found, then for every store, the process looks for a specific POG within the POG node and seasonal attribute identified above.
If a season is not specified, then the application uses the Current Season to find specific POGs for each store.
If a season is specified in the mapping table but there is no such season in the historical POGs, then the process treats this as if the season was not specified and uses the Current Season.
Exception case: If none the above techniques find a match for some stores, then the store will be unmapped and that information will be made available in the UI. The user can attempt to fix this by selecting some other POG node/season. Stores that remain unmapped after the POG mapping/manual overrides, will fall out and do not go through SO.
The following mapping errors can occur:
Demand Spread Factor (DSF) out of range (1-100). The product is mapped to more than one POG set and the total DSF across these POG sets for the product is less than 1 or greater than 100.
Unmapped Store. After matching the products from the assortment and looking for POGs within the identified POG sets, none of the stores in the cluster have a matching POG. This means that the assortment was mapped to a POG set for a product for which ASO cannot optimize any store.
Unmapped Product. This is raised because mapping data either does not exist for the product because it was not provided or it was provided but the POG Set does not exist.
Business users can view images that are provided on a customer-hosted web server on ASO virtual planograms. The W_RTL_PRODUCT_IMAGE_DS.dat interface contains a column called PRODUCT_IMAGE_ADDR that can contain the full URL to an image of the product. This URL must be in the following format:
http[s]://servername[:port]/location/filename.extension
For example:
PRODUCT_IMAGE_NAME = imagename.png
PRODUCT_IMAGE_ADDR = http://hostname/url/imagename.png
PRODUCT_IMAGE_DESC= Short description of the image
The ASO application running in the cloud does not directly access these images, so there is no need to expose these images outside of the customer's firewall. As long as the user of the ASO application has access to the URL while running the ASO application, then the user's web browser will be able to resolve the URL and retrieve the images for display when they choose this option. The images must be in a file format that the web browser can display. Since the images shown in the UI are small, these images do not need to be high quality images. The size of the image files will affect the time it takes to render the planogram with the images.
ASO consumes replenishment parameters at the product/location level and simulates a (s, S) inventory model to estimate service levels as a function of number of facings, which is one of the key inputs to the optimization engine. Lost sales are estimated as a part of service level calculations.
In addition to mapping and replenishment feeds, ASO also had another feed related to the Assortment and Space Optimization Product Stack Height Limit file. For details, see Oracle Retail Science Cloud Services Implementation Guide.
This section describes the science behind the optimization algorithms used in the ASO application. It does not provide all the details of the algorithm. It does provide some guidance so that the user can troubleshoot and resolve issues quickly during an implementation.
The optimization algorithm analyzes trade-offs and selects the best set of items from a given assortment. It then informs the user where to place these items, using how many facings, in a given planogram. The algorithm uses sophisticated mathematical modeling techniques to analyze all possible solutions to generate the best possible planogram. The optimization algorithm is provided an objective (for example, maximize total profits over all items in the assortment), business rules or restrictions, and the sales for a particular item i with k number of facings and at a particular elevation in the planogram (see Sales and Inventory Model). The algorithm analyzes the trade-offs between all possible solutions and picks the solution that gives the best value for the objective. All the restrictions imposed by the user are treated as required; that is, all possible solutions must satisfy that particular criterion.
To provide a sense of the analysis, here are some of the trade-offs that are analyzed.
Is there sufficient space to pick all items and assign the maximum number of facings? Or instead, because space is limited, which items must be dropped?
Should a particular item be included in the ultimate solution? Is there sufficient space? Or, since space is limited, does giving space to this item result in the dropping of a more profitable item?
Does picking an item cause a conflict with the imposed business rules? For example, a user might determine that the item must be placed at eye-level, but there are other items that are equally profitable that do not have any elevation restrictions.
Does dropping an item have a significant impact on the demand lost and thus revenues? Or instead, does dropping an item causes no significant loss in demand since some of the demand is transferred to other items that are selected?
For an item that is picked, is it profitable to add another facing? Or instead, is it profitable to select another item? Does adding another facing for an item cause the item to be dropped since it cannot be fit anywhere in the planogram?
Does adding another facing help in meeting the service level requirement? Or instead, can the minimum service level requirement never be met and that item must be dropped?
At a high level, this model generates sales for a particular item i with k number of facings and at a particular elevation in the planogram. This model consumes the replenishment parameters and historical sales and computes the expected sales for a particular item i with k number of facings and at a particular elevation in the planogram.
The optimization that ASO performs makes decisions about which products to put on the shelves and how many facings to give each product. The basis for these decisions is demand information for each product and how much of the demand can be satisfied with a given amount of inventory for the item. Items with high demand may need more shelf space to hold the necessary inventory, and the ASO optimization balances that against other products that may have lower demand and also lower shelf space requirements.
The term "sales" refers to that portion of the product's demand that can be satisfied by a given amount of inventory. If inventory is sufficiently high, then all of the demand can be satisfied, and then demand is equal to sales. However, for lower levels of inventory, sales may be less than demand. For each product, optimization requires the relationship between the product's demand, sales, and inventory, since ultimately sales are what matters.
The feature of ASO called Sales and Inventory modeling performs the calculations of how much of a product's demand will turn into sales for a given level of inventory. The results of these calculations are fed to the optimizer. The sales units of a product are dependent on the following:
Demand for the product
Replenishment of the product, which determines how much inventory is available to meet demand
Replenishment of the product in turn depends on:
Various replenishment parameters, such as the frequency of replenishment. These replenishment parameters are for each product-store combination.
Inventory levels immediately after replenishment. This level is a separate calculation on its own, and is not a single parameter, which is why it is discussed separately.
Because the Sales and Inventory modeling occurs before optimization, the modeling does not know on which shelf or fixture the product will ultimately end up or how many facings the products will have. Thus, the modeling performs separate calculations for each fixture that can possibly hold the product and for each possible facing value. This is a type of what-if calculation, which gives the optimizer the information about what the sales of a product would be if it were to be placed on a particular fixture with a particular number of facings. The optimizer requires this information for all possible fixtures and facings for each product so that it can make the best choices.
When replenishment of a product occurs, the portion of the shelf belonging to the product is re-stocked. The level to which the product is restocked (the order-up-to level) is partly determined by how much product will fit in the shelf space that the product will occupy. The calculation of how many units of the product will fit depends on the number of facings and how many units will fit in each facing. The latter is the units per facing capacity of the product, and depends on the product and the fixture the product is being placed on. For simplicity, units per facing capacity is called just "facing capacity".
The calculation of facing capacity consists of several steps:
Orientation. The orientation of the product is how the product sits on the shelf. For simplicity, in the remaining text, the terms "height, width, and depth" refer to the dimensions of the product after the product has been oriented correctly on the shelf. The orientation can certainly affect the number of units of the product that can fit on the shelf, and thus it is essential for each product to have its correct orientation for the shelf-space capacity calculation to produce correct results.
Stacking portion of Facing Capacity. This is the portion of Facing Capacity where the products are stacked one unit atop another, or nested inside one another, if the product allows nesting. The number of units that can be stacked when not nested depends on the height of the shelf, the height of the product, and the product's Max Stack Quantity, which takes precedence over the number of units allowed by the shelf height. If the product allows nesting, then the number of units that can be stacked depends, in addition, on the nesting height. When one item is nested inside another, some portion of its height is above the height of the item it is nested in. This portion of the height is the nesting height. This is then multiplied by the number of units of the product that will fit one behind the other within the depth of the fixture. This calculation also depends on the Above Gap and Behind Gap of the product.
Elements in this calculation: shelf height, product height, nesting height, product's Max Units High, fixture depth, product depth, Above Gap, Behind Gap.
Cap portion of Facing Capacity. This is the number of units of the product that can be put on top of the stacking portion with the product in a different orientation. The Facing Capacity is then the sum of the stacking portion and the cap portion. The cap space has dimensions shelf depth x product width x remaining height, where remaining height is the height left over after the product has been stacked. The cap-units calculation simply determines how many units of product will fit into this cap space, using the product's Cap Height, Cap Depth, and Cap Width. The product's Max Cap Quantity is a maximum of how many units of product can be stacked in the cap space.
Elements in this calculation: product's dimensions, Cap Height, Cap Depth, Cap Width, Max Cap Quantity.
If the results from sales-inventory modeling show that a product has very low service levels, meaning the product is not receiving the inventory that it needs to serve its demand, check whether the facing capacity is sufficient to meet the demand of the product. This may involve checking the elements identified above to see if they are correct.
If the facing capacity is insufficient for the demand of the product, then service levels will be low, regardless of the values for the other inventory-related settings for the product, since there is not enough room on the shelf for sufficient quantities of the product.
In addition to the units per facing capacity, the other determinant of the order up-to level of a product is the product's Maximum Capacity. This number can be interpreted in three different ways, depending on the product's settings:
The number of units of the product. This is the most straightforward, as the Maximum Capacity is itself just a count of units of the product.
The number of case packs of the product. In this case, the case pack size of the product (given in the replenishment parameters for the product) is multiplied by the Maximum Capacity to convert case packs to units. (The case pack size is given in units of product.)
The number of days of supply of the product. Here, the weekly demand for the product (from the replenishment parameters of the product) is divided by the number of days in a week, and multiplied by the Maximum Capacity to convert the Maximum Capacity into units.
Elements in this calculation: Maximum Capacity of the product, casepack size, weekly demand of the product.
The Maximum Capacity is a setting for the product and does not depend on the number of facings that the product is given.
For a given number of facings, the sales and inventory modeling determines the order up-to level by comparing two unit quantities:
The product of the number of facings and the units per facing capacity
The Maximum Capacity, after it is converted to units.
The smaller of these two values is the order up-to level used by the Sales and Inventory modeling for this number of facings. Thus, for example, if the fixture simply does not have enough space to hold the necessary inventory for a product, it will not help to increase the Maximum Capacity. If you attempt to increase the Maximum Capacity, and still the inventory for the product is not enough to meet demand, then it is time to check the Facing Capacity.
In general, if the results of the sales and inventory modeling show that a product is not receiving sufficient inventory, in addition to the elements affecting the facing capacity, also check the elements affecting the Maximum Capacity calculation.
The replenishment frequency can also affect whether the product receives sufficient inventory. The product must receive enough inventory to meet demand at least until the next review point. Thus, for example, if replenishment occurs only once per week for a product, the product's order-up-to level must be high enough to sustain at least seven days of demand for the product. If the fixture is too small to hold that much product (see the Facing Capacity section above), then increasing the replenishment frequency may help.
Element to check: replenishment frequency
The transit time and trigger type are related replenishment parameters. The recommended trigger type is Demand Based, which means the order point, which is the inventory level that will trigger replenishment, is calculated by accounting for the demand and the transit time. With a trigger type Demand based, the order point is high enough to leave enough units to meet demand until the replenishment arrives, and thus a larger transit time will mean a higher order point.
It is possible for the transit time to be so large that the order point is too high to be contained on the fixture. For example, suppose the Facing Capacity is lower than the order point. In this case, the product will continually run out of inventory, and it is necessary to either give the product more room on the fixture or decrease the transit time for the product.
Element to check: transit time
When the user runs ASO in space cluster mode, the store-sku-level parameters are used to run the simulations. For example, the replenishment parameters and price of the items are all input at the store-level. As a result, all simulation models are run at the store-level and then averaged over time for each store. The output is aggregated for space cluster level analysis.
Aggregation
If the user decides to optimize at the store-level, then no further aggregation is performed and the store-level output is sent and used as is in the optimization. On the other hand, if the user wants to optimize at the space cluster level, then the output of the simulation is aggregated to the space cluster level and is sent to the optimization. Thus, metrics such as Demand, Revenue, Gross Profit, Sales Units, and On Hand Units are all summed up where the service level is averaged (a simple average that sums up all service levels and divides by number of stores) across all the stores to arrive at one service level at the space cluster-level for a given possibility, as described in earlier sections. The optimization algorithm uses the cluster-level metrics to analyze trade-offs between all possibilities and ultimately reports the analysis in the Results tab.
The objective function specified by the user plays a major role in determining which solutions are considered best. For example, if the user specifies the objective function as maximize profit margin, then the algorithm will look for solutions that are superior on profit margin and not necessarily on the other KPIs such as revenue and sales volume. Sometimes, understanding why an item is included or dropped and why it is given so many facings might be as trivial as looking at the objective function contribution of that particular item to the objective function.
Note that the objective function not only considers contributions from products that are included in the final planogram solution but also from the dropped products, by using the Demand Transference application. The key idea here is that, for a dropped product, no sales are lost; some sales may be transferred back to other substitutable products. The Demand Transference application generates the demand transference values that may not be consumed as is. ASO provides flexibility for the ASO users to dampen the demand transference values if they are deemed too high.
There are a few choices for specifying an objective.
Maximize Sales Units. This tells the optimization to fill the planogram with items that will result in best possible sales units for selected items/facings.
Maximize Sales Revenue. For an item, sales revenue is calculated as price times the sales units. This tells the optimization to fill the planogram with items that will result in the best possible sales revenue for selected items/facings.
Maximize Gross Profit. For an item, gross profit is obtained by multiplying the difference between price and cost, and sales units. This tells the optimization to fill the planogram with items that will result in the best possible gross profit for selected items/facings.
Maximize Sales Revenue/On Hand Units. For each item, the ratio is calculated and added together. This objective tells the optimization to fill the planogram with items that result in the best possible revenue to the inventory units carried for each item.
Maximize Gross Profit Return on Investment. This objective tells the optimization to fill the planogram with items that result in the best possible total profit but that at the same time minimize the total inventory cost at the planogram-level. As one can imagine, carrying too much inventory will result in higher revenues or profits but at a higher cost of carrying more inventory. This metric lets the user strike a balance between these two metrics. There are two versions supported: Generic version when the user is unable to provide the store-level inventory. To use generic version GENERIC_GMROI_FLG is set to 'Y' in RSE_CONFIG.
Maximize Sales Units (Weighted). This objective is similar to Maximize Sales Units, except that here each item's contribution to objective is weighted by the IPI values provided by Category Manager.
Maximize Sales Revenue (Weighted). This objective is similar to Maximize Sales Revenue, except that here each item's contribution to objective is weighted by the IPI values provided by Category Manager.
Maximize Gross Profit (Weighted). This objective is similar to Maximize Gross Profit, except that here each item's contribution to objective is weighted by the IPI values provided by Category Manager.
Maximize Sales Revenue/On Hand Units (Weighted). This objective is similar to Maximize Sales Revenue/On Hand Units, except that here each item's contribution to objective is weighted by the IPI values provided by Category Manager.
Maximize Gross Profit Return on Investment (Weighted). This objective is similar to Maximize Gross Profit Return on Investment except that here each item's contribution to the objective (in numerator and denominator) is weighted by the IPI values provided by CMPO.
Weighted metrics use IPI values provided by the Category Manager. It is generally expected that IPI values are positive and hence negative or 0 values for products will be flagged as warnings since it can result in products getting dropped.
If the objective function focuses on the best possible solution, then constraints work in the opposite direction, by restricting the set of possible solutions. For example, if the objective function says to select the most profitable item A and assign the maximum number of facings (for example, 15), a constraint on item A may say it is not possible to have more than three facings for item A in order to provide a minimum number of facings to the items of the other brands.
Optimization enforces all constraints as required except for Product Family Group constraints; that is, it finds all the solutions that satisfy all the constraints except for Product Family Group constraints that are specified by the user.
Sometimes, inadvertently, the user might specify conflicting constraints that can result in no solution or unexpected solutions. Often, a resolution can be found by just understanding the implications of individual constraints. Some examples of how to analyze the constraints:
Why was item B dropped? Is the Average Weekly Demand too low?
Why did item C receive so many facings? Is this item part of Match Facings group? Or what is the minimum number of facings rule?
Why is an item placed at this elevation? What are the elevation restrictions on this item?
Why is an item in second bay and not in the first bay? Is there a blocking rule in place?
More often than not, the user must analyze the interplay between two or more constraints to see why an item is included or dropped and why it is assigned so many facings, and why is it placed in a particular bay and at a particular elevation. A Sanity Checker is provided in the ASO Actions menu that can be used to identify some of the logical conflicts that have arisen due to the definition of the constraints.
Among all the constraints specified by the user, Product Family Group constraints are enforced softly. To elaborate on the PFG constraints: Product Family Group constraints are defined using the sort attributes (up to three attributes) mentioned in the Visual Guidelines screen. Note that these Sort Attributes are also used in laying out items within a shelf. These constraints tell the optimization that products belonging to a particular combination of sort attribute1, sort attribute 2 and sort attribute 3 are to be kept together or "close enough". An example of a Product Family Group is Deodorants belonging to a Brand, Size and Scent to be placed together.
It should be noted that Product Family Group constraints are different from Same Shelf constraints or Visual Guidelines as follows:
Product Family Group constraints are a relaxation of same shelf constraints - products do not have to be kept in same shelf but in nearby shelves.
Product Family Group constraints are different from Visual Guidelines as they do not enforce any order between the groups.
Some recommendations on using Product Family Group Constraints:
ASO provides three tools to help in achieving the intended layout: Same Shelf, Visual Guidelines, and Product Family Group. Note that Sorting Attributes are dual purpose as they also help in laying out items within a shelf. Figure 9-3 explains the three concepts.
Figure 9-3 Blocking, Product Family Group, Same Shelf, Sorting Illustrated
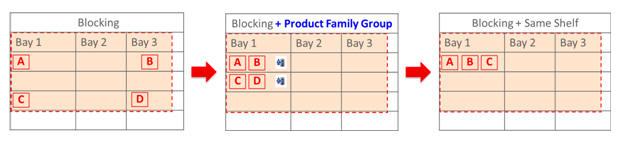
The user should make use of different tools provided to achieve the intended layout. For example, the user can define the order using the Visual Guidelines and further keep products close enough within a block, and the user can define Product Family Group constraints. PFG constraints provide the ability to keep the products together within a block (for example, vertical block + horizontal block).
An example of a redundant PFG strategy would be to use same attribute to define visual guidelines (for example, use brand to define primary vertical blocking) and for product family group (for example, use Brand for defining Product Family Group). In such a case, Visual Guidelines will keep products for each Brand together, and create blocks using the order specified. Product Family Groups are redundant here.
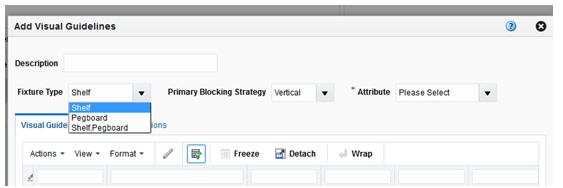
Visual guidelines are imposed as a set of constraints that restrict the placement of an item. Specification of the visual guidelines contains the following:
Blocking strategy
Primary blocking attributes (up to two attributes)
Secondary blocking attributes (up to two attributes)
A blocking strategy can have a design in which primary blocking is vertical and secondary blocking is horizontal or primary blocking is horizontal and secondary blocking is vertical. When the primary blocking is vertical, the application allows the user to specify horizontal blocking attributes by each vertical block. Similarly, when primary blocking is horizontal, the user can specify the vertical blocks by each horizontal block. Note that both strategies allow the user to specify additional horizontal blocks called top or bottom, which allows the user to put items in the top shelves or bottom shelves.
The following illustration clarifies these strategies. Assume that there are four brands, A, B, C, and D. Users also have the ability to create a merged block, as shown in the following example. Brand C and Brand D are merged to create a combined vertical block, as the user believes that these are premium brands that do not have as many SKUs as Brand A and Brand B. In the first scenario, the user wants the items placed in the following order. From left to right, the user wants to see Brand A, then Brand B, and then Brand C and D. Further, from top to bottom, the user wants to distinguish Brand A by size (since the user believes the size plays a major part in customer purchasing decision for Brand A). For Brand B, the user wants the flavors arranged from top to bottom. The (Vertical, Horizontal) strategy is shown in Table 9-1. Alternatively, the user can decide that size is the most important attribute across all brands and specify that horizontal rows of shelves should be of same size. The (Horizontal, Vertical) strategy is shown in Table 9-2.
Table 9-1 Vertical, Horizontal Strategy
| Brand A | Brand B | Brand C |
|---|---|---|
|
12 oz |
Vanilla |
- |
|
24 oz |
Chocolate |
- |
|
36 oz |
Strawberry |
Brand D |
|
- |
Multipack |
- |
Table 9-2 Horizontal, Vertical Strategy
| Brand A | Brand B | Brand C and D |
|---|---|---|
|
12 oz |
12 oz |
12 oz |
|
24 oz + vanilla |
24 oz + vanilla |
24 oz + vanilla |
|
24 oz + others |
24 oz + others |
24 oz + others |
|
36 oz |
36 oz |
36 oz |
These two strategies provide the flexibility for the user to define which takes precedence, vertical or horizontal, using only attributes. Note that the user does not actually indicate which shelves or elevation a product should be placed at. Instead, the optimization decides the shelves or elevations, based on the order of items specified by the user, using attributes. When the primary attribute is vertical, the optimization tries to follow the order specified for vertical blocks and then tries to place products by the horizontal blocks defined. In contrast, when the primary attribute is horizontal, the optimization tries to generate solutions that adhere to the horizontal blocking order and vertical blocking order that is common to all horizontal blocks. In the example above, for the former, Brand A has three horizontal blocks, Brand B has four horizontal blocks, and the merged block has two horizontal blocks. For latter, there are four horizontal blocks and three vertical blocks for all horizontal blocks.
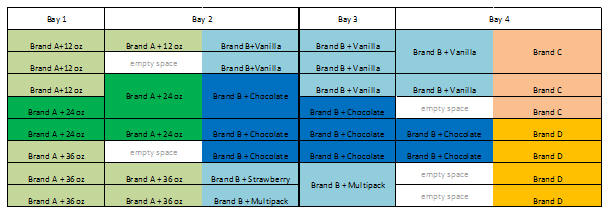
An example of solution to the primary as vertical and secondary as horizontal strategy stated in Table 6-1 is shown in Figure 9-4.
An example of solution to the primary as horizontal and secondary as vertical strategy stated in Table 6-2 is shown in Figure 9-5.
Figure 9-5 Primary Strategy as Horizontal
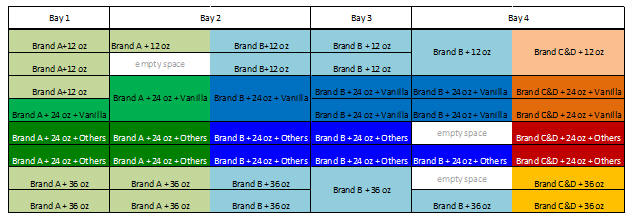
Visual Guidelines provide flexibility to model various layouts, and yet improper specification of visual guidelines can result in empty spaces or sparsely populated optimal planograms. The next few paragraphs provide some recommendations on how to use Visual Guidelines:
The user can specify visual guidelines by fixture type or common to all fixture types as shown in Figure 9-6. The user must define separate guidelines for different fixture types since products or product attributes are not common to both fixture types.
In general, adding visual guidelines restricts the optimization, so the user should create a run without any visual guidelines. Later, the user can create runs with a variety of visual guidelines. Comparing the no-VG and VG runs provides the impact of imposing visual guidelines, in terms of revenue, sales units, and so on.
It is preferred that when adding visual guidelines, the user should bear in mind to start with a simple blocking strategy (for example, primary only) and to check the results and increase complexity in terms of additional and secondary strategies.
As stated above, there are two block strategies that are supported by ASO: (a) Primary is Vertical, Secondary is Horizontal (b) Primary is Horizontal, Secondary is Vertical. In case of shelf fixtures only, each horizontal block will need at least one shelf to satisfy and thus it is a restrictive strategy than the former. Further, the second strategy, in case of shelf fixtures, needs at least one shelf for each horizontal block and thus, the number of horizontal blocks is limited to number of shelves in the bay. For example, it is pointless to define ten horizontal blocks for strategy defined in Table 9-1 as each bay has at most eight shelves
It is essential that the user does a preliminary analysis on the product counts and KPIs like Sales Units to see how well the blocks are defined. Very few products will result in thin blocks or empty spaces; low KPIs typically result in sacrificing the block for another block with better products. ASO provides Export to Excel on Product Constraint tab so that the user can check product counts. Here is an example of the process:
The user can select Custom Attributes (up to three attributes at a time) and click the Show Attributes button.
The user can then click Export to Excel and download the products with attributes information into Excel as shown in Figure 9-7.
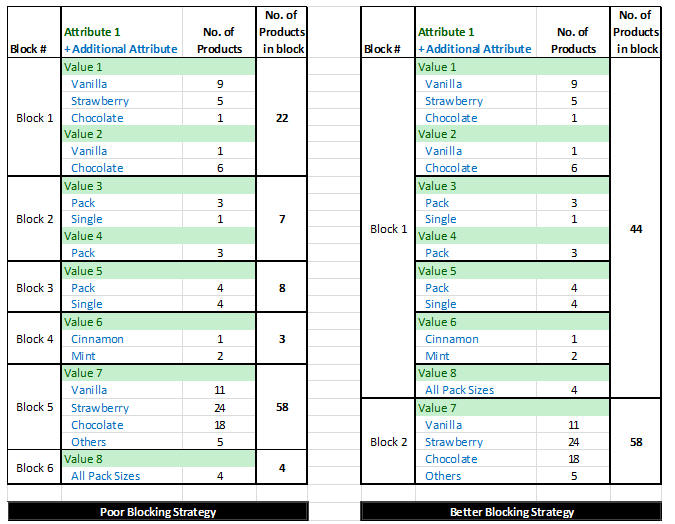
An example of the analysis is shown below: the user would like to define blocks using two attributes: Segment and Pack-size.
Exporting data to Excel and performing a pivot on the attributes gives us the Table 6-3. Attribute values highlighted in green color are Segment and others are Pack-size values.
Notice that the Mouthwash segment seems the largest in terms of product counts whereas all other segments have few products. Given the disproportionate distribution of product counts, it might be better to start with only two blocks, one for Mouthwash and rest all in others. This gives even distribution of products in all the blocks.
Next, the user needs to check the value of each block. It is possible that some blocks are not valuable and optimization can trade that block for another block with higher value. ASO Visual Guidelines screen provides the ability to see the KPIs like Sales Units, and Revenue. This gives the user the ability to understand the value of each block.
Figure 9-8 Product Counts for Blocking Strategies
Finally, the user needs to decide whether to define primary as vertical or primary as horizontal. In general, the rule of thumb is to define primary as vertical since it is less restrictive than primary as horizontal.
After optimization, the user can quickly check how the blocks are formed. Optimization tries its best to satisfy all constraints and provide optimal amount of space for each product. This can result sometimes in empty spaces within each block. In such a case, the user should revisit blocking strategy; perhaps few smaller blocks can be merged into the bigger block.
Product groups provide a set of constraints for the optimization that specify the relation between any pair of items. For example, retailer has to pair a high-margin product with low-margin product or retailer has to match number of facings for shampoos and conditioners. ASO provides a few variants on these constraints.
Table 9-3 Product Group Constraints
| Constraint | Description |
|---|---|
|
At Least |
At least m items must be selected in the final assortment. |
|
Exact |
Exactly m items must be selected in the final assortment. |
|
At Most |
At most m items must be selected in the final assortment. |
|
All or Nothing |
If one item from this group is selected, then all other items in this group must be selected in the final assortment. |
|
Match Facings |
Whatever items are selected, all the items selected must be given same number of facings. |
|
Same Shelves |
Whatever items are picked, they must be placed on the same shelf in the final planogram (only applicable for shelf fixture type). |
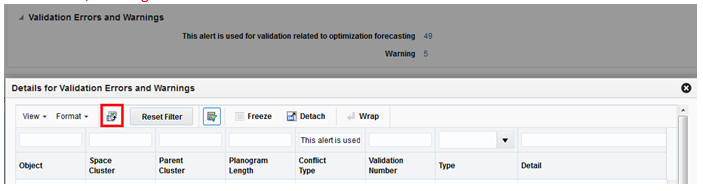
This feature helps the user to identify logical conflicts that may occur because of the constraints imposed and provides guidance on how to resolve the issues. The validation feature generates two types of alerts: Error and Warning. Error is generated when the set of constraints result in no solution. Warning is informative in nature and does not necessarily result in no solution. The user should try to understand why an error or warning is generated and examine the resolution provided.
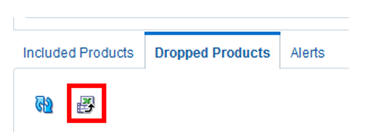
The Dropped Products tab provides information on which products are dropped and the high-level reason why they are dropped. Coupled with Validation Errors/Warnings, the user can get an idea on why a product is dropped. The user should try to understand why an error or warning is generated and examine the resolution provided.
Further, the user should use Export to Excel to understand the high-level issues for dropped products. They are categorized primarily as follows:
Do Not Include.
No Solution. When the optimizer cannot satisfy the constraints specified, then it does not return any solution. For example, if all items need minimum of ten facings and are mandatory. This is not physically possible on the POG with such constraints and hence optimizer will return no solution.
User Constraints. When a product cannot fit into any shelf due to its geometry or display orientation. To identify which products, the user should refer to Validation Errors/Warnings panel.
Missing Sales and/or Forecast Data. As stated, a product does not get included because there is missing data. To identify which data elements are missing, the user should refer to Validation Errors/Warnings panel.
Invalid Sales and/or Forecast Data. As stated, a product does not get included because there is invalid data (for example, price = 0). To identify which data elements are invalid, the user should refer to Validation Errors/Warnings panel.
Minimum Service Level. When a product cannot satisfy the minimum service level (for example, 90%) then the product is dropped from the POG. Refer to the Sales and Inventory Model section of the Implementation Guide on how it can be improved.
Solver Choice. This can be due to the objective defined and contribution of the item compared to the space needed for that item. Some examples of why Solver (or Optimization) drops the items:
Item has very low demand; the user should check why the demand is low.
Item got dropped due to low service levels since it needs many facings to meet minimum service level requirement.
Item got dropped because optimization compared the item's contribution to the objective function to the space needed and decided that it is best if that space is given to another product.
In general, the user can conduct the diagnosis of the errors/dropped products as follows:
Go to Dropped Product panel and use the Export to Excel functionality. Looking at the Reason column, the user can determine why a product was dropped.
To identify further specifics about the errors, the user can click Validation/Errors and click the hyperlink and use the Export to Excel functionality. This gives specific product-cluster errors/warnings.
Before an SR is submitted, the user should review this checklist to identify any issues. If the issue is not resolved by walking through this checklist, then an SR can be submitted. Note that when an SR is submitted, the user must provide the following information:
Issue description and expected behavior. As the below details are gathered, be sure the selections in the UI match the expectations and that the constraints were not specified for the wrong cluster.
Validation Errors/Warnings Excel (using Export to Excel feature)
Dropped Products Excel
Replenishment Data
Visual Guidelines Excel (using Export to Excel feature in Visual Guidelines UI)
Analysis of Visual Guidelines Excel ((for example, Product Counts by Attributes used in defining the Visual Guidelines. See section Diagnosis of Visual Guidelines)
VPOG Screenshot (Using All Visual Guidelines display option)
Run Number, Space Cluster ID
Monitoring the batch processes can help you make sure that the complete data required for ASO to function correctly is being used.
Here is an overview of the process.
Make sure the daily files (RI_RMS_DATA.zip) are sent.
Approximately an hour after an intraday process starts, retrieve the ORASE_INTRADAY_extract.zip from the FTP server and remove it. Do not send a new intraday set of data files before you retrieve and remove the extract file.
If the extract file not is available on the FTP site, the intraday process has failed. If this is the case, you will receive an email from Oracle Support regarding the errors that caused the failure (see"Batch Process Failure"). Do not send a new intraday set of data files before you have resolved the errors. Any data sent in the intraday zip file that failed is not guaranteed to have loaded. (The failure may have prevented the loading of some files.) Once you have resolved the cause of the load failure, send a new intraday zip file that includes the data previously provided.
Review the global validation issues in the so_global_val_detail.txt and so_global_val_smry.txt files provided in the extract file for possible issues (see "Global Validation Issues"). Resolve the issues identified, and resend the appropriate data required to fix those issues.
This section describes the process for addressing a batch process failure.
When a batch process failure occurs, Oracle Support sends you an email notification similar to the following example.
> Subject: ORASE Batch Process - ORASE - LOADERRORS
>
> This is an auto-generated email
>
> Customer: Department Store
> Environment: Production
>
> Batch Type: ORASE Batch
> Batch Frequency: intraday
> ############### Data Load Error Summary
> INTERFACE ERROR_DATE ERROR_ID NUM_ERRORS ERROR_DESCR
> ------------------------------ -------------------- --------- ------------ --------------------------------------------------------------
> SO_DISPLAY_STYLE_STG 2018/04/04 02:02:15 2014024 3 Display style key does not exist in so_prod_display_style_stg (incoming display styles).
In this example, the email message indicates that three records in so_display_style_stg.txt have keys that do not have corresponding display style keys in so_prod_display_style_stg .txt. In other words, a value was provided in the so_display_style_stg key column that did not exist in the so_prod_display_style_stg display_style_key column. To resolve the error, you must add the missing display style keys to so_prod_display_style_stg .txt.
In order to see the data that is in error, you must review the corresponding BAD table. Log into the application as a user with the enterprise role of FORECAST_MANAGER_JOB. Then, using the Data Management/Manage Configuration menu option, select the appropriate table that corresponds to the interface. For example, interface SO_DISPLAY_STYLE_STG contains error records in table SO_DISPLAY_STYLE_BAD.
This section describes the process for addressing global validation issues.
Here is an example file:
2025040|SO_GV_MAPPING_ASSORT_POG_NO_POGSET|Assortment to POG mapping data is using a POG Set that does not exists.|SO_POG_ASSORT_MAPPING_STG|POG_DEPT_KEY|POG_CATEGORY_KEY|POG_SUB_CATEGORY_KEY|Y|2017-10-22
2025041|SO_GV_MAPPING_ASSORT_POG_SEASON_NO_POGSET|Assortment to POG seasonal mapping data is using a POG Set that does not exists.|SO_POG_ASSORT_SEAS_MAPPING_STG|POG_DEPT_KEY|POG_CATEGORY_KEY|POG_SUB_CATEGORY_KEY|Y|2017-10-22
In this example, the errors indicate that the assortment-to-POG mapping data and assortment-to-POG seasonal mapping data are using POG sets that were not provided. The list of the missing sets is available in the so_global_val_detail.txt file. To resolve the error, you must send the missing planograms in the appropriate data files (see "Sending Data in Data Files").
Figure 9-10 contains a list of global validation error conditions that are checked for, and may be reported in the so_global_val_smry.txt and so_global_val_detail.txt files. The information contained in the table can help identify the interface that has an issue, along with a reference of columns that are related to the data issue.
Table 9-4 Global Validation Errors
| Error ID | Name | Description | Interface | Column1 Name | Column2 Name | Column3 Name |
|---|---|---|---|---|---|---|
|
2025001 |
SO_GV_DS_NO_ORIENTATION |
Display Style is missing orientation data. |
SO_DISP_STYLE_ORIENTATION_STG |
DISPLAY_STYLE_KEY |
- |
- |
|
2025002 |
SO_GV_DS_NO_FIXTURE |
Display Style is missing fixture data. |
SO_DISPLAY_STYLE_FIXTURE_STG |
DISPLAY_STYLE_KEY |
- |
- |
|
2025010 |
SO_GV_POG_MISSING_STORES |
POG is missing store information. |
SO_POG_STORE_STG |
POG_KEY |
- |
- |
|
2025011 |
SO_GV_POG_MISSING_BAYS |
POG is missing bay information. |
SO_POG_BAY_STG |
POG_KEY |
- |
- |
|
2025012 |
SO_GV_POG_MISSING_FIXTURE |
POG is missing fixture information. |
SO_BAY_FIXTURE_STG |
POG_KEY |
- |
- |
|
2025013 |
SO_GV_POG_BAY_MISSING_FIXTURE |
Bay is missing fixture information. |
SO_BAY_FIXTURE_STG |
BAY_KEY |
POG_KEY |
- |
|
2025014 |
SO_GV_POG_SHELF_FIXTURE_NO_SHELVES |
A shelf fixture is missing shelves data. |
SO_SHELF_STG |
FIXTURE_KEY |
POG_KEY |
- |
|
2025015 |
SO_GV_POG_WRONG_FIXTURE_TYPE |
Non shelf fixture has shelves assigned to it. |
SO_FIXTURE_STG |
KEY |
POG_KEY |
- |
|
2025016 |
SO_GV_POG_WRONG_FIXTURE_COMBINATION |
POG has an invalid fixture combination (Shelf, Pegboard, Freezer or Shelf/Pegboard). |
SO_FIXTURE_STG |
POG_KEY |
- |
- |
|
2025020 |
SO_GV_ASSORTMENT_NO_CLUSTERS |
Assortment does not have mandatory assortment clusters. |
SO_ASSORTMENT_STG |
ID |
- |
- |
|
2025021 |
SO_GV_ASSORTMENT_NO_PRODUCT |
Assortment does not have mandatory products. |
SO_ASSORTMENT_STG |
ID |
- |
- |
|
2025022 |
SO_GV_ASSORTMENT_CLUSTER_NO_STORE |
Assortment cluster has no stores. |
SO_ASSORT_CLUSTER_STG |
ASSORTMENT_ID |
CLUSTER_KEY |
- |
|
2025023 |
SO_GV_ASSORTMENT_CLUSTER_NO_PRODUCT |
Assortment cluster (cluster level assortment) has no products. |
SO_ASSORT_CLUSTER_STG |
ASSORTMENT_ID |
CLUSTER_KEY |
- |
|
2025024 |
SO_GV_ASSORTMENT_STORE_NO_PRODUCT |
Assortment store (store level assortment) has no products. |
SO_ASSORT_PRODUCT_STRCLTR_STG |
ASSORTMENT_ID |
CLUSTER_STORE_KEY |
LOCATION_KEY |
|
2025025 |
SO_GV_ASSORTMENT_NO_FORECAST |
Assortment is missing forecast data. |
SO_ASSORT_PROLOC_FCST_STG |
ASSORTMENT_ID |
- |
- |
|
2025026 |
SO_GV_ASSORTMENT_PRODLOC_NO_FORECAST |
Assortment product/location is missing forecast data. |
SO_ASSORT_PROLOC_FCST_STG |
ASSORTMENT_ID |
PRODUCT_KEY |
LOCATION_KEY |
|
2025027 |
SO_GV_ASSORTMENT_NO_PRICE_COST |
Assortment is missing price and cost data. |
SO_ASSORT_PROLOC_FCST_STG |
ASSORTMENT_ID |
- |
- |
|
2025028 |
SO_GV_ASSORTMENT_PRODLOC_NO_PRICECOST |
Assortment product/location is missing price/cost data. |
SO_ASSORT_PROLOC_PRICECOST_STG |
ASSORTMENT_ID |
PRODUCT_KEY |
LOCATION_KEY |
|
2025029 |
SO_GV_ASSORTMENT_PRODUCT_NO_DISPLAY_STYLE |
Assortment product does not have a display style. |
SO_DISPLAY_STYLE_STG |
ASSORTMENT_ID |
PRODUCT_KEY |
- |
|
2025030 |
SO_GV_ASSORTMENT_PRODUCT_NO_REPLENISHMENT |
(Assortment) Product/location does not have replenishment data. |
SO_PROD_LOC_REPL_PARAM_STG |
ASSORTMENT_ID |
PRODUCT_KEY |
LOCATION_KEY |
|
2025031 |
SO_GV_ASSORTMENT_SAME_CATEGORY |
Assortment overlaps with another assortment for the same product category. |
SO_ASSORTMENT_STG |
ID |
- |
- |
|
2025040 |
SO_GV_MAPPING_ASSORT_POG_NO_POGSET |
Assortment to POG mapping data is using a POG Set that does not exists. |
SO_POG_ASSORT_MAPPING_STG |
POG_DEPT_KEY |
POG_CATEGORY_KEY |
POG_SUB_CATEGORY_KEY |
|
2025041 |
SO_GV_MAPPING_ASSORT_POG_SEASON_NO_POGSET |
Assortment to POG seasonal mapping data is using a POG Set that does not exists. |
SO_POG_ASSORT_SEAS_MAPPING_STG |
POG_DEPT_KEY |
POG_CATEGORY_KEY |
POG_SUB_CATEGORY_KEY |
More details about so_global_val_smry.txt and so_global_val_detail.txt files can be found in the Data Interface document ri_orase-<release number>-intf.xlsx. The link to the document can be found on the documentation site under Oracle Retail Insights Cloud Service Suite/Oracle Retail Science Cloud Services Data Interface.
This section describes the data that must be sent in specified files. Note that, for each set of files, the text indicates whether the files must be an incremental or a full dataset.
Each time an assortment is delivered, all the data elements that define that assortment must also be delivered within the related interface files. Note the following:
If an assortment appears within so_assortment_stg file, it is expected that the data for that assortment will be delivered again within the other files as well. A full replacement of that assortment and all its components is performed, using the data in the set of files.
A change in the assortment resets the mapping and optimization data used for runs. The optimization work for that assortment must be re-started.
A new assortment can be delivered at any time without impacting an existing assortment.
The last two files in Table 9-5 are used to signal the finalization of the assortment set. They are both optional (that is, the data does not have to be delivered in every submission).
SO_ASSORT_PROLOC_PRICECOST_STG contains two fields: COST and INVENTORY_COST. The difference between them is that former is the unit product cost and the later is the unit cost of inventory. The later field is only useful when a user selects GMROI as the objective.
Table 9-5 Assortment-Related Files
| File Name | Requirement |
|---|---|
|
SO_ASSORTMENT_STG |
Mandatory |
|
SO_ASSORT_CLUSTER_STG |
Mandatory |
|
SO_ASSORT_CLUSTER_MEMBER_STG |
Mandatory |
|
SO_ASSORT_PRODUCT_STRCLTR_STG |
Mandatory |
|
SO_ASSORT_PROLOC_FCST_STG |
Mandatory |
|
SO_ASSORT_PROLOC_PRICECOST_STG |
Mandatory |
|
SO_ASSORT_PHPROD_LIKE_PROD_STG |
Optional |
|
SO_ASSORT_PHPROD_ATTR_STG |
Optional |
|
SO_ASSORTMENT_FINALIZED_STG |
Optional |
|
SO_ASSORT_PHPROD_FINALIZED_STG |
Optional |
Every time a planogram is delivered, all the data elements that define that planogram must also be delivered in the related interface files. Note the following:
A new bay cannot simply be added to an existing POG. If the POG must be changed, all the components must be delivered again. A full replacement of the POG and all the data elements related to it is performed.
The POG resets the mapping and optimization data used for runs. The optimization work for that POG SET must be re-started.
A new POG can be delivered at any time. However, there can be an impact if the new POG belongs to an existing POG SET in which other POGs are already present. This also causes a reset to the mapping and optimization data used for runs.
Each time a display style is delivered, the related information must be delivered in these files. The existing information is refreshed with the new information, a full replacement of the display style and its components.
Adding or changing a display style for a product can be done at any time. It does not reset the mapping and optimization data used for runs. This information can be delivered.
This data can be delivered at any time for POGs that were previously delivered or that are being delivered in the same batch. These files are optional. They do a full replacement of data that may have already been delivered for the same POGs.
Data from these files does not reset the mapping and optimization data used for runs.
These interface files can be delivered incrementally. You do not need to provide the full set every time, only deltas and changes. For large files such as replenishment files, only updates are required, not the full set each time.
Data from these files does not reset the mapping and optimization data used for runs.