| Oracle® Retail Science Cloud Services User Guide Release 19.1.003.2 F40914-01 |
|

 Previous |
 Next |
| Oracle® Retail Science Cloud Services User Guide Release 19.1.003.2 F40914-01 |
|
Previous |
Next |
This chapter describes the use of Inventory Optimization (IO). For details about the implementation of IO, see Oracle Retail Science Cloud Services Implementation Guide.
Inventory Optimization (IO) is used to understand the trade-offs between the service level and the inventory cost and to help retailers set strategies for the safety stock or the service level. These data-driven strategies are translated into item-location replenishment policies that are pushed to replenishment systems, such as Oracle Retail Merchandising System (RMS), Oracle Retail Advanced Inventory Planning (AIP), or any external system, to generate and execute orders. To provide full visibility, the replenishment policies are also used within IO to calculate optimal transfers and purchase orders. In addition, IO recommends optimal rebalancing transfers between stores to increase sell-through and to avoid markdowns. This type of strategy can be turned off when not applicable (for example, for grocery categories).
IO leverages historical sales and inventory, business requirements such as lead time and review schedule, and the demand forecast to generate the trade-off curves and calculate the optimal replenishment policies. (The embedded forecast engine in IO provides the demand forecast and the returned forecast. The forecast can also be provided by an external forecast system.) The demand forecast takes into account different factors such as demand transference, variation across customer segments, holidays and promotions, and returns (primarily for fashion and hardline categories).
User roles are used to set up application user accounts through Oracle Identity Management (OIM). See Oracle Retail Advanced Science Cloud Services Administration Guide for details. The following role is supported in this application:Inventory Analyst
IO supports two kinds of runs: user runs and batch runs. Batch runs are scheduled to run automatically at regular intervals (for example, weekly or daily). User runs are typically created by the user to do what-if analysis and/or to override the recommendations generated by the latest batch run. IO runs generate recommendations at item-location level. The items that are included in a run can be selected by specifying one, a multiple, or all of the nodes at a higher merchandise level, such as department. This level is configurable. Similarly, the locations that are to be included in a run can be selected by specifying one, a multiple, or all of the nodes at a higher location level, such as area. This level is configurable.
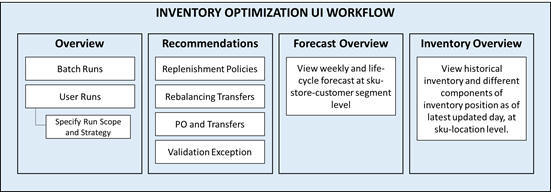
Figure 12-1 shows an overview of the IO UI workflow, which consists of the following:
Run Overview: This is the dashboard for the IO runs. In this tab, the user can see a list of all existing runs, along with details that describe each run. Runs have four different statuses: Setup, In Progress, Successful, and Failed.
From the run overview table, the user can create a run, copy a run, open a run, or delete a run. When the user clicks on a successful run, it is opened in a new tab with three sub-tabs to show replenishment policies, rebalancing transfers, and PO and transfers, as well as a sub-tab to show the summary of inputs of the run. For a failed run, only the input summary sub-tab is displayed. To create a run, the user must specify the run scope and strategy. As part of the run scope, the user specifies the areas and departments for the run and the type of analysis to be performed. As part of run strategy, the user can specify the business rules.
Recommendations: This is the main screen where the user can view, override, and submit/approve different types of recommendations. This screen shows the approved/submitted recommendations across all runs and the ready for review recommendations from the most recent run. This screen consists of five sections.
Overview–A calendar view that shows the summary of different type of recommendations and provides a link for the user to open and view the details of recommendations for each date.
Replenishment Policies–Used to review and approve replenishment policies and to set service level strategies.
Rebalancing Transfers–Used to review, override, and submit/approve rebalancing recommendations.
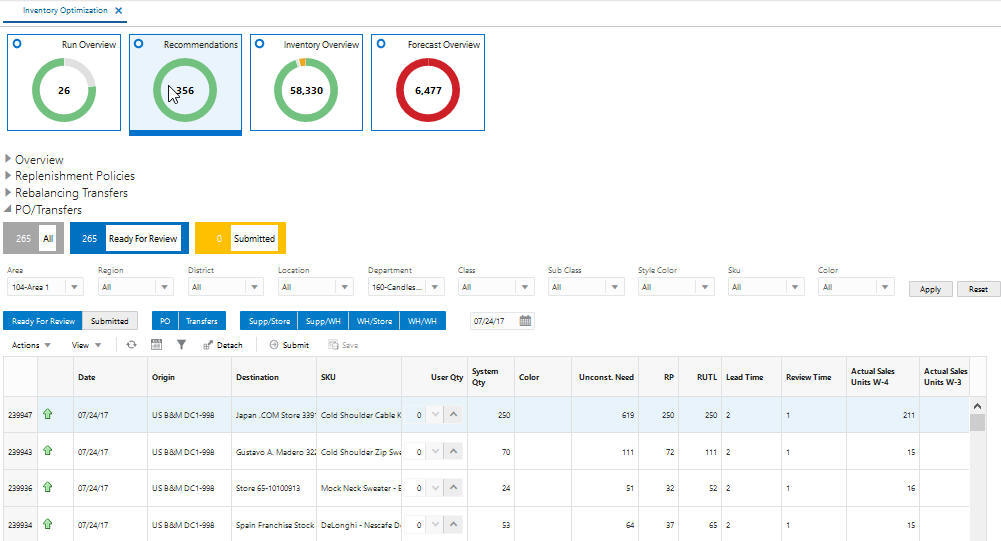
PO/Transfers–Used to review, override, and submit recommended PO and transfers. These include warehouse/supplier to store and warehouse/supplier to warehouse.
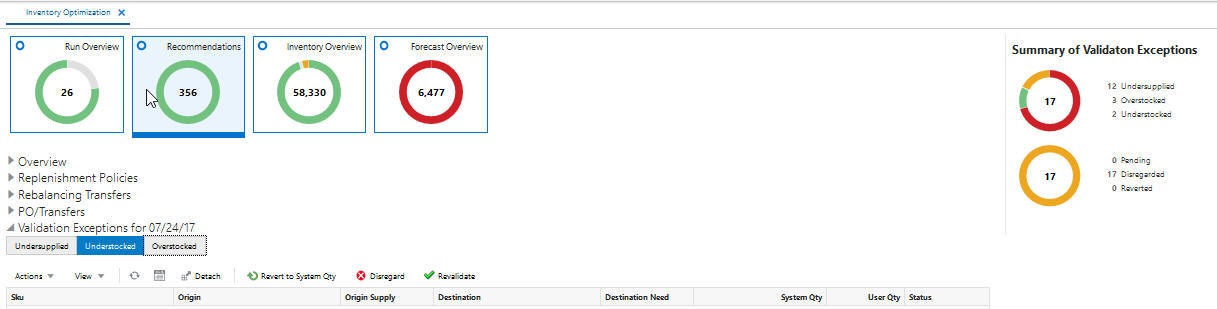
Validation Exception–When the user overrides the recommended order quantity for rebalancing, PO, or transfers, the overridden value may exceed the available supply at the origin or may be more or less than the quantity needed at the destination. In the validation exception section, the user can see these types of warnings and revert the override if desired.
Inventory Overview–Used to view the inventory levels and the historical trend of the inventory at the item-location level.
Forecast Overview–Used to view the demand forecast of the item-locations and the historical trend of sales across all customers as well as for each customer segment.
Figure 12-1 Inventory Optimization UI Workflow
Inventory Optimization generates the following outputs:
Replenishment Policies
The replenishment policies are characterized by two parameters: re-order point (RP) and receive up-to level (RUTL). These parameters are optimized and generated at the sku-location level on a weekly/daily basis. Replenishment policies can be reviewed and approved by the user or may be auto-approved. The auto/user approved policies are pushed to the retailer's replenishment system to generate and execute transfers and purchase orders.
Trade-Off Curves
These curves show the trade-off between metrics such as inventory cost and sales revenue for different target service levels for some horizon in the future. Trade-off curves are generated at the sku-location and at the aggregate level. Based on the trade-offs, the user can change the strategy for the target service level at the sku-location or at the aggregate levels.
Rebalancing Transfers and Purchase Orders and Transfers
IO optimizes the distribution of inventory through the life cycle for every SKU and throughout the entire supply chain network. It provides point-in-time and time-phased purchase orders and transfers (warehouse-to-store and warehouse-to-warehouse), and rebalancing transfers (store-to-store).
Rebalancing transfers are the transfers between stores. The goal of rebalancing transfers is to shift unproductive inventory and place it in locations that have a higher likelihood of selling and with a better margin, while minimizing the total cost of transfers (for example, shipping costs and any upcharges). Rebalancing transfers are generated at the sku-origin-destination level. The user can review the recommended rebalancing transfers and submit or approve them. If submitted, the transfers are pushed to the retailer's order execution system and must be approved before they can be executed. If approved, the transfers are pushed to the retailer's execution system in the approved mode and will be executed on the transfer date.
Purchase orders and transfers are the recommended purchase orders and transfers that are generated based on the optimal replenishment policies, inventory positions, and primary source of replenishment for the store and other factors. The user can review these recommendations within IO. In this release these recommendations are not integrated with the retailer's order execution system and primarily provide information about the time phase view of orders.
You use the IO interface to review recommendations, create a new run, or review the output of a what-if run.
The following actions are available:
Override and save. Used when the user overrides a recommended value, for example, a recommended order quantity for rebalancing transfers.
Approve. Indicates that the selected recommendations are approved by the user in IO and will be sent in approved mode to the retailer's replenishment system, such as RMS. Approved recommendations are executed immediately and do not require further approval in the replenishment system.
Submit. Indicates that the selected recommendations are submitted by the user in IO and will be sent in worksheet mode to retailer's replenishment system, such as RMS. Submitted recommendations are not executed immediately and must be reviewed and approved within the replenishment system before they are executed.
Within the Task Menu in the main dashboard, two links are available for Inventory Optimization, as shown in Figure 12-2
IO Overview
Click IO Overview to open the Run Overview screen. In this screen you can see the overview of existing runs and access the output of each run. You can also can create new What-if runs to conduct further analysis.
Manage IO Recommendations
Click Manage IO Recommendations to open the Recommendations screen. A time-phased view of the recommendations is displayed, providing details for each recommendation type. You can perform actions related to reviewing, overriding, and approving different types of recommendations. An inventory analyst will use this screen on a daily/weekly basis.
Manage Configurations
The link for Manage System Configurations is accessible through the Strategy & Policy Management Dashboard, which is under Control & Tactical Center in the task menu. Administrative users can use this link to access the configuration tables and override configuration parameters.
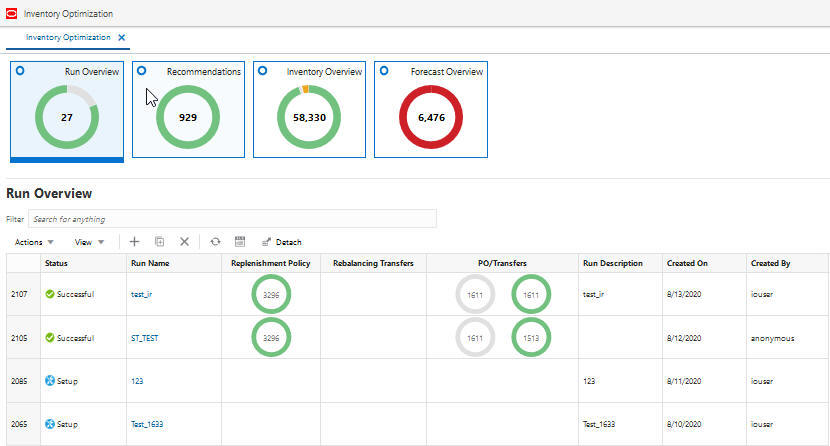
From Inventory Optimization, select IO Overview to access the All runs screen, shown in Figure 12-3. Use this screen to examine the list of runs, review the details of a run's output, and create a new run.
You see tiles for Run Overview, Recommendations, Inventory Overview, and Forecast Overview, as well as a panel on the right that lists Recent Successful Runs.
When you click on the Run Overview tile, the Run Overview table is displayed, as shown in Figure 12-3. The Run Overview table provides information described in Table 12-1.
Table 12-1 Run Overview Table
| Column | Description |
|---|---|
|
Status |
The status of the run. Values are Setup, In Progress, Successful, and Failed. |
|
Run Name |
Click the run name to open the run and see the run details. |
|
Replenishment Policy |
Displays the total number of recommendations for replenishment policies at the SKU/location level, with a breakdown by approval status (auto-approved, user-approved, ready for review). Replenishment policies are optimized and generated for every SKU/location based on their review schedule. Recommendations are characterized by two parameters, RUTL and RP. |
|
Rebalancing Transfers |
Displays the total number of rebalancing recommendations at the SKU-origin/destination level, with a breakdown by approval status (auto-approved, user-approved, submitted, ready for review).Rebalancing transfers are optimized to shift unproductive inventory and place it in locations that have a higher likelihood of selling and with a better margin, while minimizing transfer costs such as shipping cost and upcharges. |
|
PO/Transfers |
Displays the total number of PO/transfer recommendations at the SKU/origin/destination level, with a breakdown by submission status (submitted, ready for review), as well as a breakdown by PO/transfer type (supplier-to-store, supplier-to-warehouse, warehouse-to-store, warehouse-to-warehouse). Recommendations for purchase orders and transfers are generated based on the optimal replenishment policies, inventory positions, and primary source of replenishment for the store and other factors. |
|
Run Description |
User-provided information. |
|
Created On |
Date the run was created. |
|
Created By |
User login name of person creating the run. |
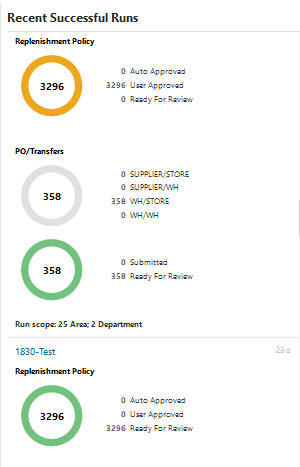
This panel, shown in Figure 12-4, provides a graphic representation summarizing the results for recent successful runs. The numbers shown in the contextual area are same as the numbers shown in the run overview table. See Table 12-1 for description of these numbers.
To see the output of a run, click a run name in the All Runs table or the contextual area in the Run Overview screen. The run output opens in a new tab with four sub-tabs. The first three sub-tabs show the three types of recommendations generated by the run. These sub-tabs are counterparts to the three sections (Replenishment Policy, Rebalancing Transfers, and PO/Transfers) in the Recommendations screen. In the Recommendation screen, you can see the recommendations across all runs; in the Run Output screen, the recommendations specific to a certain run are shown. When you approve or submit a recommendation in a run, it replaces the previously approved recommendations for the same merchandise/location combination. Details regarding the four sub-tabs in the Run Output screen are explained below.
Replenishment Policies Tab
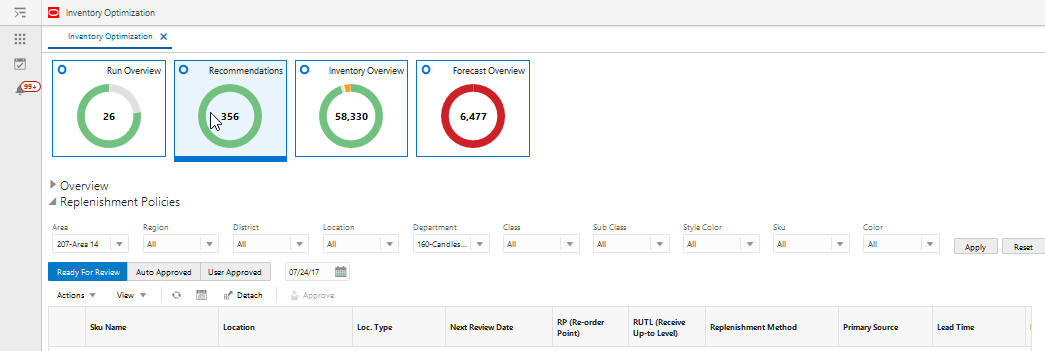
The Replenishment Policies tab provides information about replenishment policies, which are characterized by two parameters: re-order point (RP) and receive up-to level (RUTL). These parameters are optimized and generated at the sku-location level based on their review schedule.In this screen you can review the parameters and select one or multiple policies from the table and click the Approve button to approve them. If there is already an approved replenishment policy for the selected SKU/locations, it will be replaced by this new policy. In order to approve replenishment policies for all SKU/locations, click the Approve All button. This will approve the replenishment policy for all SKU/locations that were optimized as part of this run.
The following columns are displayed in the Replenishment Policies tab. For a description of many of these columns, see "Glossary of Inventory Optimization Terms."
SKU Name
Location
Location Type
Next Review Date
RP (Re-order Point)
RUTL (Receive Up-to Level)
Replenishment Method
Primary Source
Lead Time
Review Time
Actual Sales Units
Forecast Sales Units
Forecast Sales Units RT + LT
Total Forecast Return Units
Forecast Return Units RT + LT
Approved By
Rebalancing Transfers Tab
The Rebalancing Transfers are transfers between stores You can use the Table View and the Map View buttons to change the presentation in this tab. The Map View and Table View are explained in the Recommendations Section and shown in Figure 12-9 and Figure 12-10.
The following columns are displayed in the Rebalancing Transfers tab. For a description of many of these columns, see "Glossary of Inventory Optimization Terms."
Recommendation ID
Date
Origin
Destination
SKU
Color
User Quantity
System Quantity
Shipping Cost
Forecast Sales Units at Destination
Total Forecast Return Units at Destination
On-Hand Quantity at Destination
In-Transit Quantity at Destination
On-Order Quantity at Destination
Back-Order Quantity at Destination
Forecast Sales Units at Origin
Forecast Surplus Units at Origin
Total Forecast Return Units at Origin
On-Hand Quantity at Origin
In-Transit Quantity at Origin
On-Order Quantity at Origin
Back-Order Quantity at Origin
Approved On
Approved By
PO/Transfers Tab
The purchase orders and transfers are the recommended purchase orders and transfers that are generated based on the optimal replenishment policies, inventory positions, and primary source of replenishment for the store and other factors.
The following columns are displayed in the PO/Transfers tab. For a description of many of these columns, see "Glossary of Inventory Optimization Terms."
Recommendation ID
Date
Origin
Destination
SKU
System Quantity
User Quantity
Approved Quantity
Approved By
Approved On
Last Approved Quantity
Last Approved Recommended
Unconst, Need
RP
RUTL
Load Time
Review Time
Actual Sales Units
Forecast Sales Units
Total Forecast Return Units
Forecast Return Units RT + LT
On-Hand Quantity at Destination'
In-Transit Quantity at Destination
On-Order Quantity at Destination
Back-Order Quantity at Destination
On-Hand Quantity at Origin
In-Transit Quantity at Origin
On-Order Quantity at Origin
Back-Order Quantity at Origin
Activate Date
Deactivate Date
Selling Start Date
Scope and Strategy Tab
The Scope and Strategy tab provides a summary of scope and strategy that were specified for the run when run was created. It shows selected product/location nodes and strategies such as target service level and product/locations with no-replenishment rule.
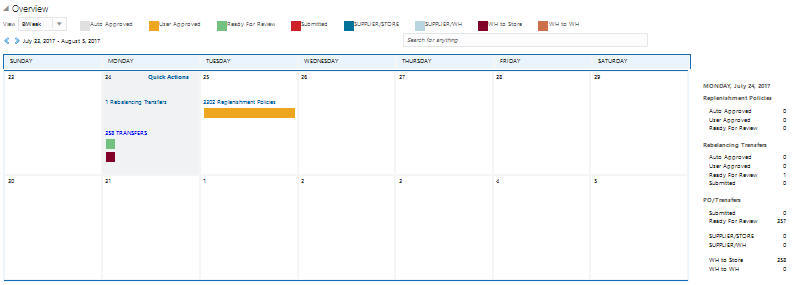
Overview
The Overview section shows the Calendar, as shown in Figure 12-5. You can change the view for the calendar by selecting Week, Biweek, or 4 Weeks. The calendar provides details about all types of recommendations for the current date and future dates. The user can see the number of recommendations for different types and different submit/approval statuses in the panel on the right. For each day in the calendar, click the link of a recommendation type to open the corresponding panel.
You can click Quick Actions for a specific date to approve or submit recommendations in bulk without examining the details or overriding quantities. Quick actions are only available for recommendations for the current date.
Replenishment Policies
This section shows the replenishment policies at sku-store level and the underlying data that is used for the calculations (sales forecast, service level, lead time, and so on).
The contextual area, shown in Figure 12-7, displays the trade-off analysis at the sku-store level and higher levels of merchandise and location that are configured during implementation. The trade-off curves indicate how the lost sales and inventory units change for different target service levels. The second graph shows the ratio between lost sales units and average on-hand inventory. To see the same graphs for amounts rather than units, use the toggle buttons at the top of the contextual area.
Figure 12-7 Replenishment Policies Contextual Area
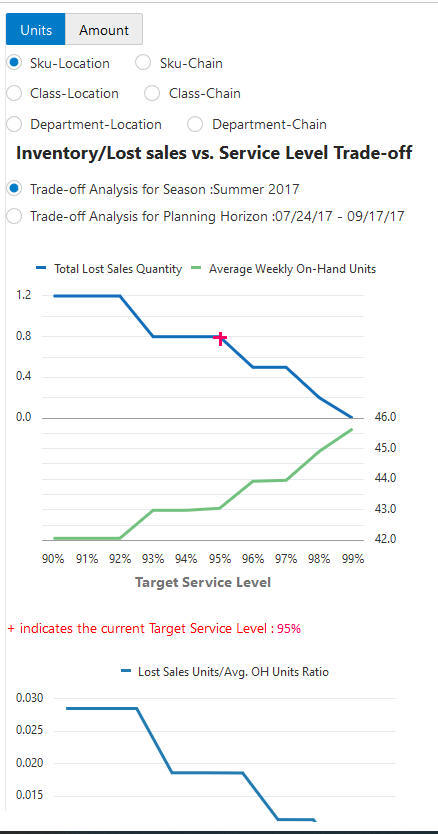
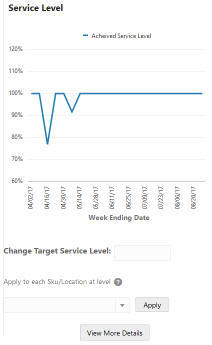
Other graphs in the contextual area show historical sales and inventory as well as the historical service level for the sku-store selected in the table. Review the trade-off curves and historical measures at the sku-store or aggregate level to evaluate the performance of the current service level strategy and then change the strategy if desired. To change the target service level, scroll down to the bottom of contextual area (as shown in Figure X), enter a value in the input text box, select a level from the drop-down and click Apply. The new target service level is applied to all sku-stores under the selected merchandise-location level and is considered in the replenishment policy optimization for the next batch run.
The information and actions in the contextual area can be viewed in a larger pop-up by clicking View More Details at the bottom of the contextual area.
Figure 12-8 Replenishment Policies Contextual Area - Change Target Service Level
Rebalancing Transfers
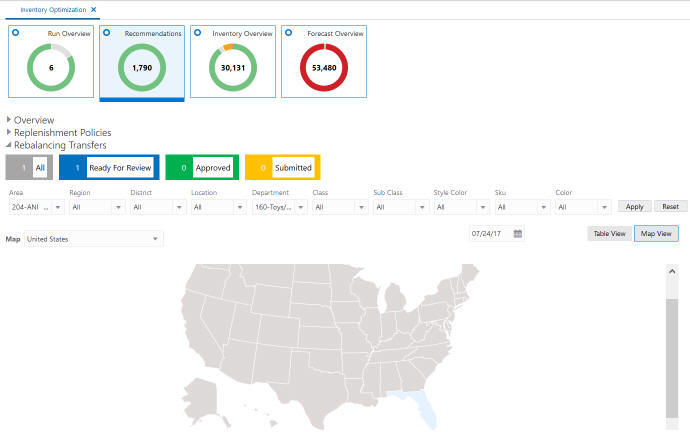
The Rebalancing Transfers section has two views, the Table View and the Map View. The Map View is shown in Figure 12-9 and the Table view as shown in Figure 12-10. To switch between Table View and Map View, use the buttons located in the top right.
Figure 12-9 Rebalancing Transfers Map View
The Table View displays the recommended store-to-store transfers. The user can override the transfer quantity and submit or approve the recommendation. If submitted, the transfers are pushed to the retailer's order execution system and must be approved before they are executed. If approved, the transfers are pushed to the retailer's execution system in approved mode and will be executed on the transfer date.
Figure 12-10 Rebalancing Transfers Table View
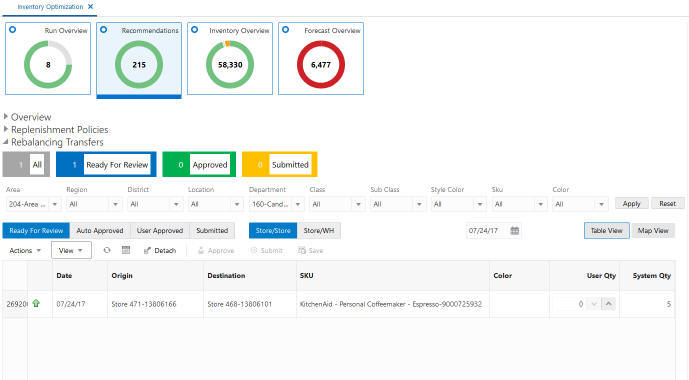
The number tiles above the table shows the total number of recommendations with different statuses across all merchandise and locations.
The Map View displays the number of transfers within each areas of the map (for example, within each state of the United States). If a transfer is between two different areas, it is only included in the area where the origin is located. Clicking on an area in the map opens a pie chart that shows the breakdown of transfers based on transfer quantity.
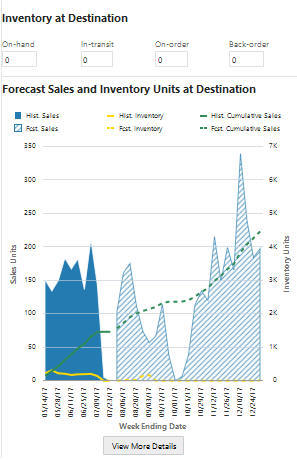
In the contextual area, the top area shows the flow of inventory between the origin and the destination, as well as to and from other origins and destinations. The flow shown in this diagram is based on approved and submitted recommendations for the selected date in the table. If there are no submitted or approved recommendations between the two nodes on the selected date, the number on the arrow between the two nodes is shown as zero. The bottom area in the contextual area shows information such as product image, inventory quantities, and forecast sales at the destination. To see a more detailed view of sales and forecast and both the origin and the destination, your can click the View More Details button at the bottom of the contextual area. Figure 12-10 and Figure 12-11 show the Contextual Area of PO/Transfers section which displays similar contents for PO and transfers.
PO and Transfers
The PO and Transfers section is shown in Figure 12-11. This section displays the recommended purchase orders (supplier-to-warehouse and supplier-to store) and transfers (warehouse-to-store).
The user can override the transfer quantity and submit the recommendation. Unlike rebalancing transfers (store-to-store), the purchase orders and warehouse-to-store recommendations are pushed into order execution systems when submitted.
The number tiles above the table shows the total number of recommendations with different statuses across all merchandise and locations.
Since user is able to override the quantities with arbitrary values, it is likely that the overridden quantities result in an over-stock (sending more than required to a store/warehouse), under-stock (sending less than required to a store/warehouse), or under-supplied (pulling more than available from a warehouse). Whenever the user submits a PO/Transfer, a validation process runs to check for any of these three types of exception. If any exception is found, a warning is shown to the user and user will be given the choice to ignore the exception and proceed to submit, to cancel the submit action, or to view the exception. The exceptions can be viewed in the Validation Exception section.Note that when running the validation process, only the previously submitted PO/Transfer recommendations that have an order date as current date are taken into account. Rebalancing transfers and future recommendations are not considered in the validation process.
The contextual area, shown in Figure 12-12 and Figure 12-13, displays similar data and graphs to the contextual area of rebalancing transfers. (The contextual area is described in detail in "Rebalancing Transfers".)
Figure 12-12 PO Transfers Contextual Area - Top
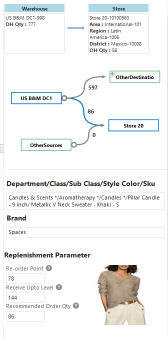
Figure 12-13 PO Transfers Contextual Area - Bottom
Validation Exception
The Validation Exception section, shown in Figure 12-14, displays the exceptions that were generated by the system when the user tried to submit a PO/Transfer recommendation. The user can disregard the exceptions so that they no longer appear in the table or can revert the quantity to the system quantity for all recommendations that are tied to an exception.
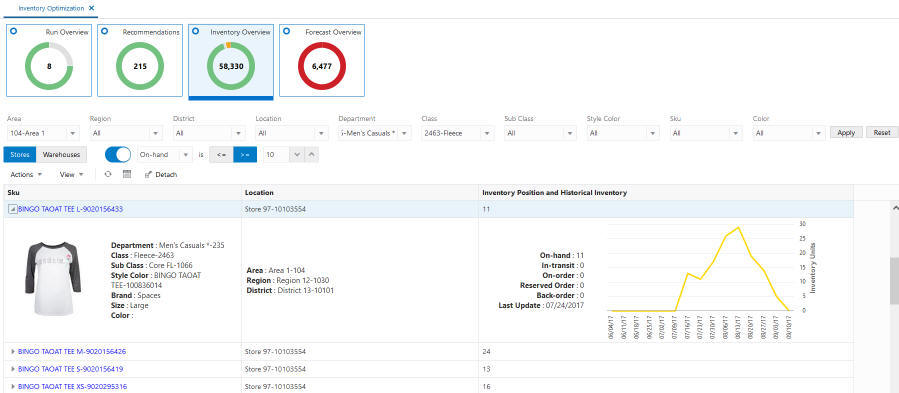
The Inventory Overview is a view-only screen that displays historical inventory data at the sku-location level, as shown in Figure 12-15.
You can filter the data based on the hierarchy or the on-hand, on-order, in-transit, reserved order, or back-order type of inventory quantity. You can select Store or Warehouse or both. You can use the numeric filter by selecting the type of inventory quantity and the type of operation (<= or >=). then enter a numeric value and click Apply.
You can expand the display at the SKU level. You can see the hierarchy for SKU and location as well as details about the inventory and when the data was last updated.
The donut shows locations that either have stock-outs and/or back-orders or do not have any stock-outs or back-orders.
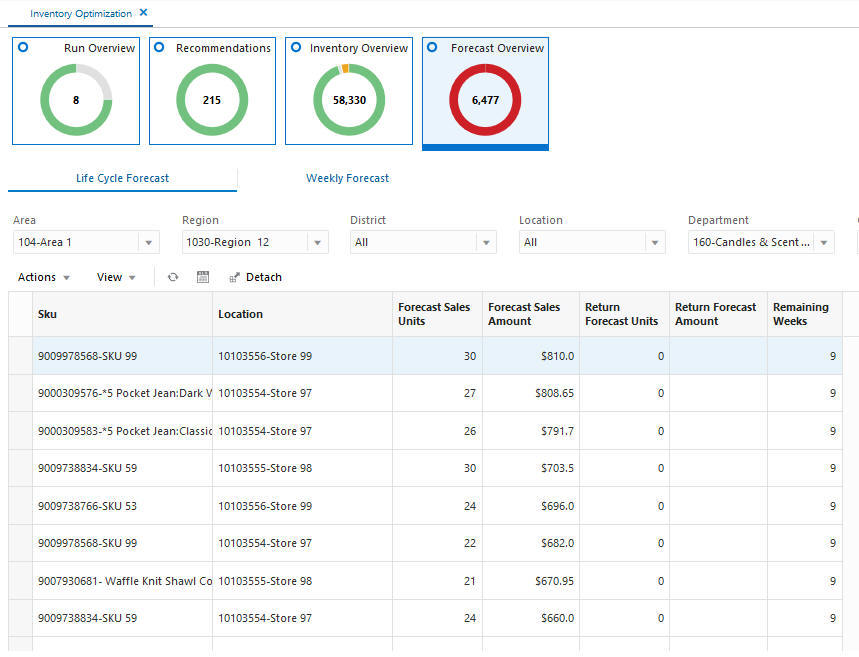
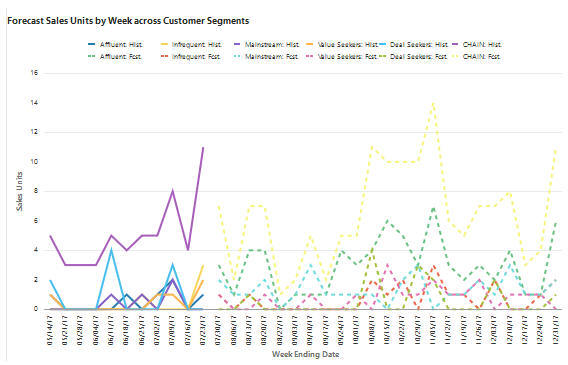
User can see forecast and historical sales at the sku-store-customer segment level and historical and forecast rate of returns at sku-store level. These metrics can be viewed at the week level or for the life cycle, which are represented by separate tabs. In the Forecast Overview Tile, the donut shows the number of locations with different rates of sell through (for example, less than 25%, between 25% and 50%, and so on.).
Life Cycle Forecast Tab
The following columns are displayed in the Life Cycle Forecast tab. For a description of many of these columns, see "Glossary of Inventory Optimization Terms."
SKU
Location
Forecast Sales Units
Forecast Sales Amount
Return forecast Units
Return Forecast Amount
Remaining Weeks
Weekly Forecast Tab
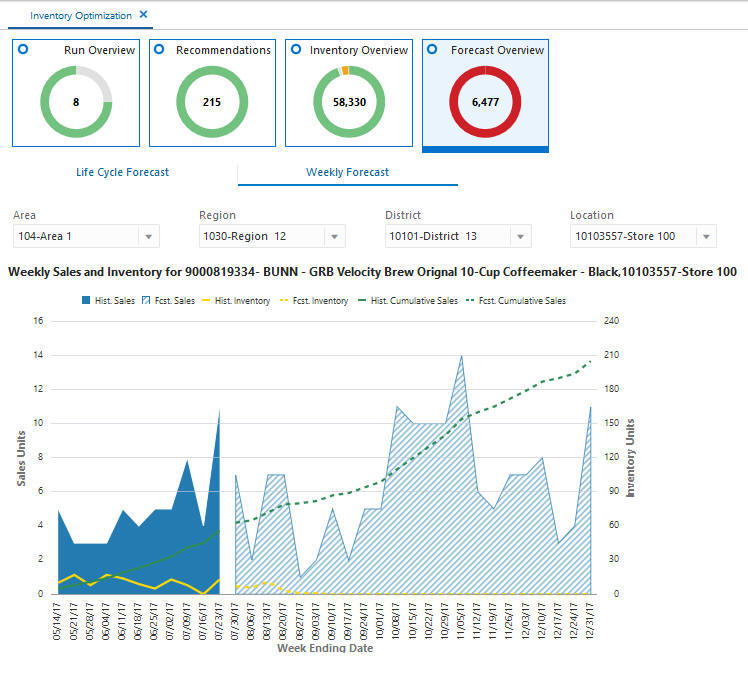
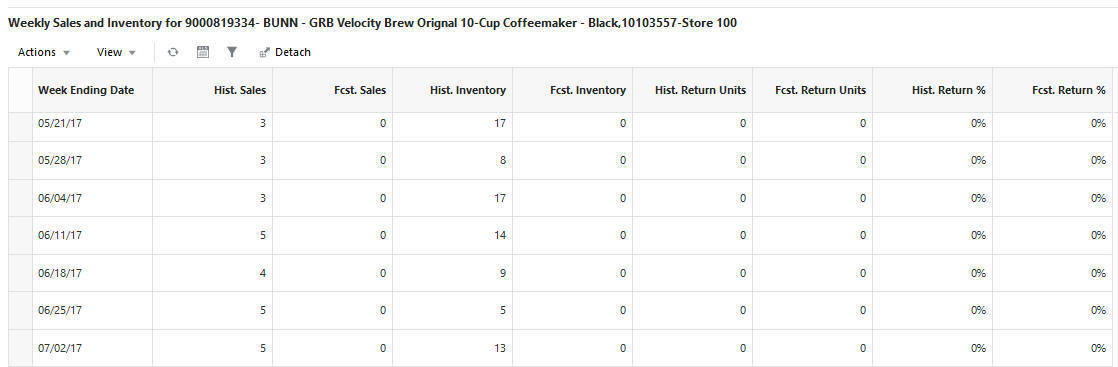
Figure 12-19 Weekly Sales and Inventory Chart
The following columns are displayed in the Weekly Sales and Inventory tab. For a description of many of these columns, see "Glossary of Inventory Optimization Terms."
Weekly Sales Data
Historic Sales
Historic Inventory
Forecast Inventory
Historic Return Units
Forecast Return Units
Historic Return %
Forecast Return %
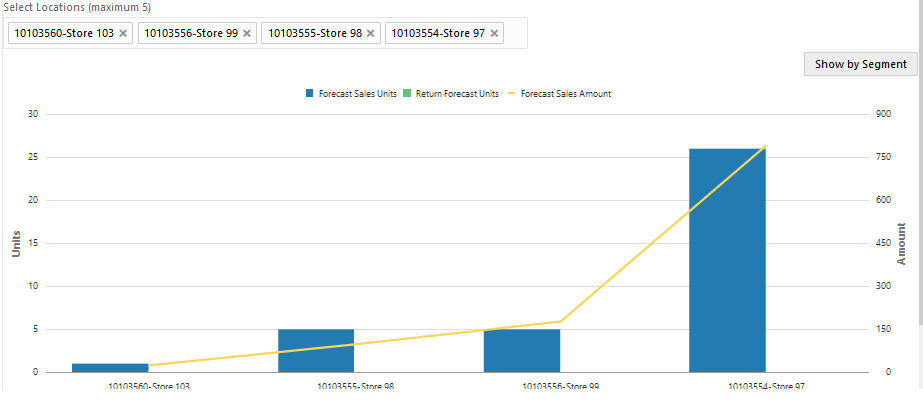
Figure 12-20 Forecast Sales Units by Week
The runs in IO are primarily batch runs that are executed weekly or daily, based on the configurations of the application. The user can create ad-hoc runs to do what if analysis or to generate recommendations to override the batch runs. To create a new run, user must define the scope and the strategies.
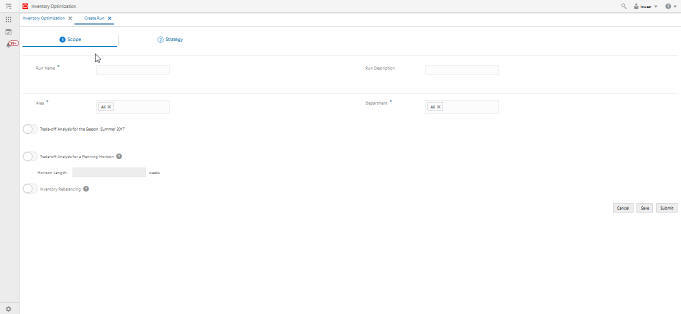
To create a new run, click on the plus (+) icon in the All runs table in Run Overview screen. The Create Run screen with the Scope tab enabled is displayed, as shown in Figure 12-21.
Create Run Scope
To create the run scope, complete the following steps.
Enter a run name and description.
Select the merchandise and locations to be analyzed in the run. The user can select at a single level for merchandise (for example, department) and at a single level for location (for example, Area). These levels are configurable. (See Oracle Retail Science Cloud Services Implementation Guide for details.) By default, all values under the merchandise and location level are selected.
Select the type of analysis that you want to perform as part of this run. By default, the replenishment policies and PO/transfer recommendations are generated in all runs. To perform analysis and generate recommendation for rebalancing transfers and trade-off curves, select the related options in the Scope tab.
The trade-off analysis for the season can only be selected for future seasons (that is, before the season start date). The trade-off analysis for a planning horizon can be selected for a minimum of two weeks and a maximum of eight weeks.
If you have already created a run with a trade-off analysis for the season, you will not be able to submit a run for the same season again. You will see a warning message that indicates that the trade-off analysis for the selected season has already been performed. For a trade-off analysis for a planning horizon, you can only submit a run for a horizon that does not completely overlap with a horizon that you have selected in the past. For example, if you have already submitted a run for a three-week horizon between 09/14/2020 and 10/04/2020, you will not be able to submit a new run for a two-week horizon between 09/14/2020 and 09/28/2020. You will be able to submit a run for a longer horizon (for example, between 09/14/2020 and 10/18/2020). In this case, the older trade-off analysis with a shorter horizon will be replaced by the new analysis that has a longer horizon.
Create Run Strategy
To create the run strategy, complete the following.
Three strategies can be defined/modified in this tab.
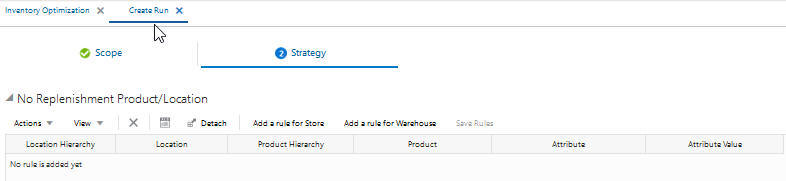
No Replenishment Product/Location. Use this section to select product/locations that should be excluded from replenishment. Product/locations can be selected based on hierarchy and/or attributes. For these product/locations, no replenishment policy and no PO/transfers will be generated. These product/locations will still be considered in the rebalancing analysis and may be recommended for a rebalancing transfer. The user can select the product and locations at a different level of hierarchy or by attribute.
There are other strategies that can be specified for replenishment and rebalancing. These strategies can be defined using the data interface for IO strategy rules. For more details and the type of rules that can be defined through interface, see the Oracle Retail Science Cloud Services Implementation Guide.
Figure 12-22 Strategy - No Replenishment Product/Location
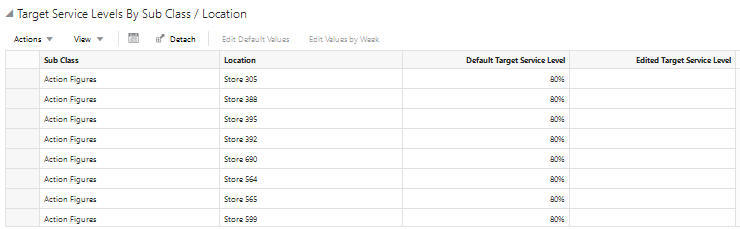
Target Service Levels. The user can override the target service level at the product-parent/location-parent level or the product-parent/location-parent/week level.
Figure 12-23 Strategy - Target Service Levels
Inventory Rebalancing Strategy. The user can select one or more objectives for optimizing the rebalancing transfers from the list presented by selecting the relevant check boxes.
Minimize shipping cost
Maximize total unit sales
Maximize unit sales for customer segments
The first objective optimizes the rebalancing transfers so that the total cost of the transfers is minimized. The second and third objectives optimize the rebalancing transfers so that the unproductive inventory is moved to locations with the greatest likelihood of being sold and with the highest margin. There is a trade-off between these objectives. When all objectives are selected, the trade-off in the optimization is captured by setting an upper bound on the total shipping cost. (See Oracle Retail Science Cloud Services Implementation Guide for details.)
This table provides definitions for many of the terms that are used in the Inventory Optimization tables in the UI.
Table 12-2 Inventory Optimization Term Definitions
| Term | Definition |
|---|---|
|
Activate Date |
For seasonal items and items with a short life cycle, the activate date indicates the date that a given item/location should be considered for replenishment. |
|
Actual Sales Units W-1 |
Actual sales unit for a given item/location during the last calendar week prior to the date that the inventory optimization ran. |
|
Actual Sales Units W-2 |
Actual sales unit for a given item/location during the last two calendar weeks prior to the date that the inventory optimization ran. |
|
Actual Sales Units W-3 |
Actual sales unit for a given item/location during the last three calendar weeks prior to the date that the inventory optimization ran. |
|
Actual Sales Units W-4 |
Actual sales unit for a given item/location during the last four calendar week prior to the date that the inventory optimization ran. |
|
Back-order Qty at Dest. |
The back-order quantity at the destination location for a given item. |
|
Back-order Qty at Origin |
The back-order quantity at the origin location for a given item. This field will be blank for a PO because the origin is a supplier. |
|
Deactivate Date |
For seasonal items and items with a short life cycle, the deactivate date indicates the date that a given item/location should be stopped being considered for replenishment. |
|
Fcst. Return Units RT+LT |
Forecast return unit for the period of review time plus lead time. |
|
Fcst. Sales Units RT+LT |
Forecast sales unit for the period of review time plus lead time. |
|
Fcst. Sales Units W+0 |
|
|
Fcst. Sales Units W+1 |
|
|
Fcst. Sales Units W+2 |
Forecast sales unit for a given item/location for the next two calendar weeks. |
|
Fcst. Sales Units W+3 |
Forecast sales unit for a given item/location for the next three calendar weeks. |
|
In-transit Qty at Dest. |
The in-transit inventory for the destination location for a given item. |
|
In-transit Qty at Origin |
The in-transit inventory for the origin location for a given item. This field will be blank for a PO because the origin is a supplier. |
|
Lead Time |
The expected number of days required to move the item from the primary source to the destination location. |
|
Loc. Type |
Location type can be Store or Warehouse. |
|
Next Review Date |
For a given item/location, the next review date is the date that the item is going to be reviewed for replenishment based on its review schedule. |
|
OH Qty at Dest. |
The on-hand inventory at the destination location for a given item. |
|
OH Qty at Origin |
The on-hand inventory at the origin location for a given item. This field will be blank for a PO because the origin is a supplier. |
|
On-order Qty at Dest. |
The on-order inventory at the destination location for a given item. |
|
On-order Qty at Origin |
The on-order inventory at the origin location for a given item. This field will be blank for a PO because the origin is a supplier. |
|
Primary Source |
The primary source of replenishment for a given item/location. If the item/location has a stock category of warehouse-stocked (or cross-docked), the primary source will indicate the warehouse from which (through which) the item will be sourced. If the item has a stock category of direct to store/warehouse, the primary source will indicate the supplier. |
|
Replenishment Method |
The method that was used in calculating the RP/RUTL. The two supported methods in this release are Normal (indicating that demand distribution is assumed to be Normal), and Poisson (indicating that demand distribution is assumed to be Poisson). |
|
Review Time |
Number of days between the day that the inventory optimization runs and the next time that a given item/location is scheduled for review. For example, if an item/location has a daily review schedule, the review time will be one day. |
|
RP (Re-order Point) |
Level of inventory that is used as a threshold to recommend an order. |
|
RUTL (Receive Up-to Level) |
When the inventory level falls below the re-order point, an order is recommended to raise inventory to this level. |
|
Selling Start Date |
The date of the first sales for a given item at a given location. For seasonal items, this date indicates the date of the first sales during the most recent season. |
|
Space Capacity (Units) |
The maximum capacity for a given item in a given location (combined between shelf and back-room). If this number is provided, the RUTL is adjusted so that it does not exceed the space capacity. |
|
System Order Qty |
The recommended order quantity for a PO/Transfer. The system order quantity is calculated by the optimization algorithm and is the quantity that takes into account all constraints such as RP, RUTL, space capacity, and available supply at the origin. |
|
Target Service Level |
This is the value of the service level that is used in the safety stock calculation. Service Level is defined as the percentage of unit demand that should be met by inventory. Valid values are between 0 and 1. For example, a service level of 0.9 indicates that RP and RUTL should be optimized such that on average 90% of the demand is met. |
|
Total Fcst. Return Units |
Total forecast return units for the remaining weeks of the item/location life cycle. This is applicable for items with a short life cycle that have an exit date. |
|
Unconst. Need |
The unconstrained need is the quantity that is required to bring the inventory up to the RUTL. It does not take into account the shelf space capacity and the potential shortage of supply at the origin. |
|
User Order Qty |
This is the user override for the quantity of the recommended PO or transfer order. |