3. Origination Dashboards
This chapter contains the following sections:
3.1 Maintenances
This section contains the following topics:
- Section 3.1.1, "Maintaining Origination Dashboard Details"
- Section 3.1.2, "Maintaining Origination Dashboard Role Details"
3.1.1 Maintaining Origination Dashboard Details
You can maintain dashboard related information using the ‘Origination Dashboard Maintenance’ screen. You can invoke this screen by typing ‘ORDDSHMT’ in the field at the top right corner of the Application tool bar and clicking the adjoining arrow button.
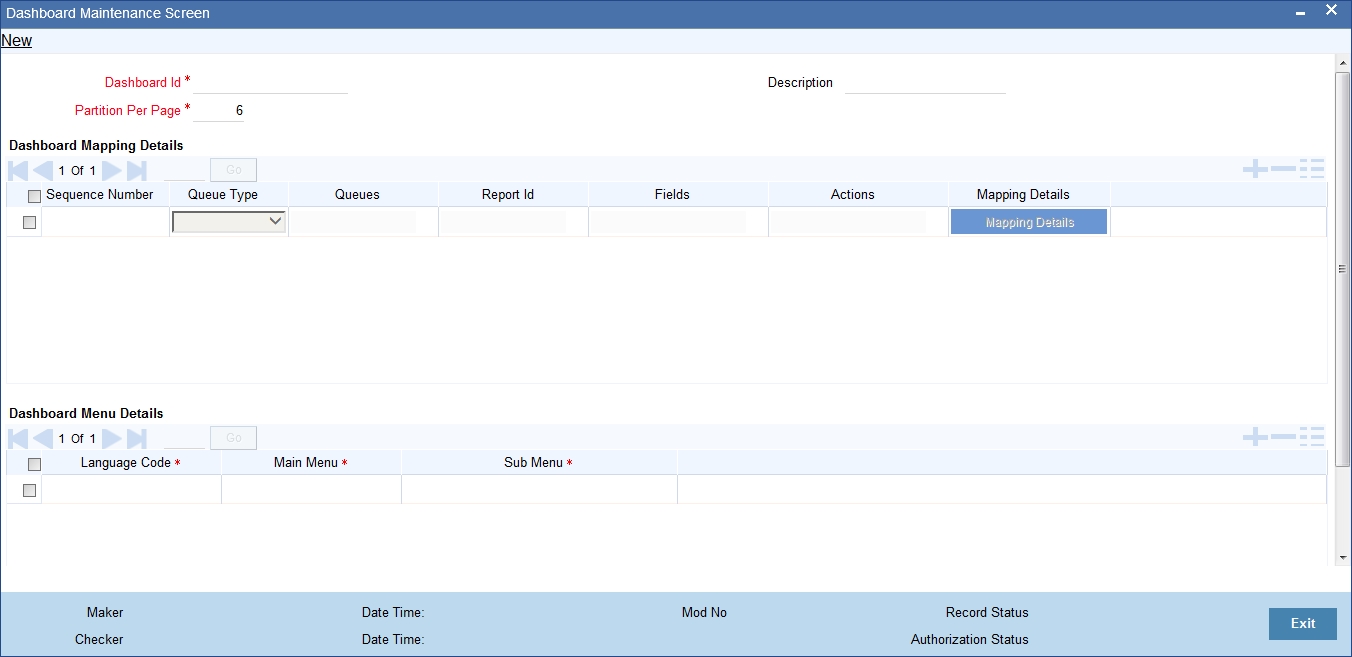
Specify the following details:
Dashboard Id
Specify the dashboard id here.
Partition Per Page
Specify the number of partitions to be displayed per page.
Description
The system displays the dashboard description in the task pane.
Dashboard Mapping Details
Sequence Number
Specify the sequence number for the dashboard. It is used to sequence the order in which the frames are displayed in dashboard.
Queue Type
Select the queue type from the adjoining drop-down list. This list displays the following values:
- Queue - If you select this option, then system displays all valid queue ids in the ‘Queue Id’ option list.
- Count - If you select this option, then system displays the title for the frame selected.This is used when you want to configure a summary dashboard having multiple queue and their corresponding count.
- Report- If you select this option, then system displays all valid report ids in the Report Id option list.
- Alert Summary- If you select this option, then system displays all valid Queue Ids and report ids in the Queue Id and Report Id option list
- Summary- If you select this option, then system displays all valid Queue Ids in the Queue Id option list.
Queue ID
If the ‘Queue Type’ is ‘Queue’, then the adjoining option list displays all valid queue ids maintained in the system. If the ‘Queue Type’ is ‘Count’, then the adjoining option list displays the title for the view.
Report Id
Select the report id for the dashboard from the adjoining option list. This list displays all valid report ids maintained in the system.
Fields
System displays the fields of the dashboard here, based on the fields selected from the ‘Mapping Details’ screen.
Actions
System displays the fields of the dashboard here, based on the fields selected from the ‘Mapping Details’ screen.
Note
Each dashboard should have minimum one and maximum six frames. If more than six dashboards are mapped to the main menu dashboard, then system displays the error message, “Cannot map more than 6 Queues for a Dashboard.”
Dashboard Menu details
Language Code
Specify the language code of the dashboard.
Main Menu
Specify the main menu name here.
Sub Menu
Specify the sub menu name here.
3.1.1.1 Specifying the Mapping Details
You can select the fields and actions by clicking the ‘Mapping Details’ button in the ‘Origination Dashboard Maintenance’ screen. This screen is used to select the action and columns that you want to perform on a particular frame of the dashboard ..
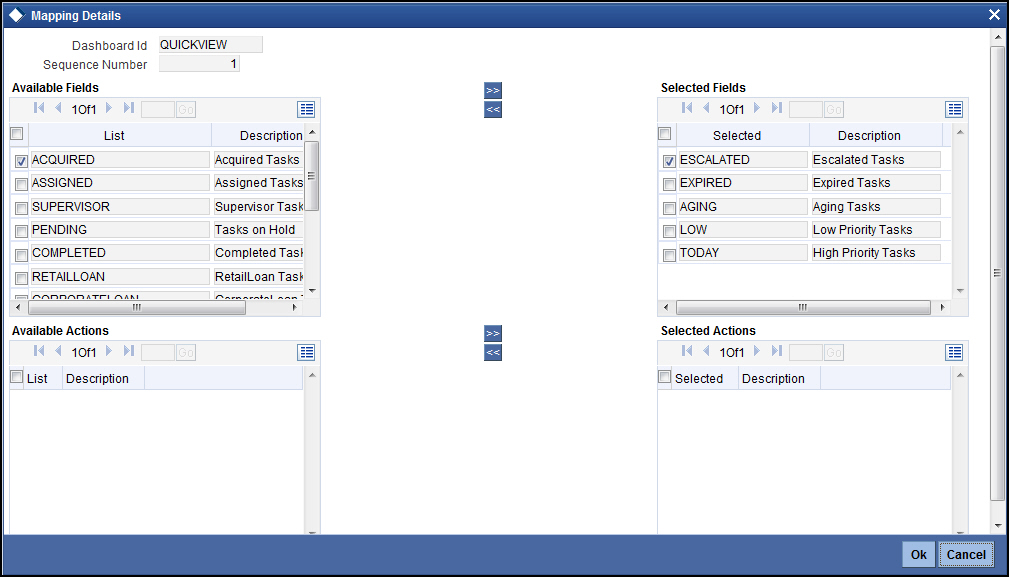
In this screen, you can select the required fields and actions for the dashboard from the Available Fields and Available Actions. Available fields displays all the queues maintained from SMDQUEMT screen, if the option selected is Count in queue type. Available action displays all the actions listed in the header of the task bar. On clicking the right-arrow button, system moves the selected fields and actions to the Selected Fields and Selected Actions sections respectively. Similarly, to de-select an action or a field, click the left-arrow button. Available fields displays blank if the queue type is selected queue and if the option is selected as ‘Queue’.The mapping details are not allowed if the queue type is selected as BAM. The system displays an error message as “No field mappings available for selected queue criteria”.
3.1.1.2 Navigating Across Dashboards
Instead of having multiple dashboards for the same set of Criteria Queue/ Report/Count, there is a facility to map them all to the ‘Dashboard Maintenance Screen’. Mapping is based on the priority of the sequence number specified. You can also configure the partition to be displayed in the dashboard per page. If there are more than one page then navigation is allowed both ways (ie. To and Fro).
3.1.2 Maintaining Origination Dashboard Role Details
You can define the role and user for each dashboard using the ‘Origination Dashboard Role Maintenance’ screen. You can invoke this screen by typing ‘ORDDSHRL’ in the field at the top-right corner of the Application tool bar and clicking the adjoining arrow button.

Specify the following details:
Map To
You can map user role to alert or dashboard.Select the appropriate option,i.e.Alert or Dashboard from the option list
Dashboard Id
Select the dashboard id from the adjoining option list. This list displays all valid dashboard ids maintained in the system.
Description
System displays the description for the selected dashboard ID/alert ID.
Map To
Select the dashboard mapping from the adjoining drop-down list. This list displays the following values:
- Role - If you select this option, then you can map the dashboard user with specific roles.
- User - If you select this option, then you can map the dashboard to a user.
User/Role Id
Select the user id or role id (based on the mapping type) from the adjoining option list. This list displays all valid user ids and role ids maintained in the system. You can select the appropriate one.
Map to Quick View
Check this box to indicate that the dashboard should be included in the Quick View frame in the left corner of the ‘Tasks’ tab of Oracle FLEXCUBE, for a specific user or role.
Set as Landing Page
Check this box to set this dashboard as the landing page dashboard. If you check this option, the user will see this as the default dashboard when navigated to the ‘Tasks’ tab of Oracle FLEXCUBE.
If a dashboard is mapped as default for a role or user id, then you cannot map another dashboard as default. The system displays an error as “User /Role already has default dashboard” in such case.
If there are different dashboards mapped to role and user id having the same role, then dashboard mapped to the user id will take precedence over the dashboard mapped as default for the role.
3.2 Process Code Maintenance
This section contains the following topics:
3.2.1 Maintaining Process Code Details
You can maintain the process code details in the ‘Process Code Maintenance’ screen. To invoke this screen by type ‘STDPCODE’ in the field at the top-right corner of the Application tool bar and click the adjoining arrow button.
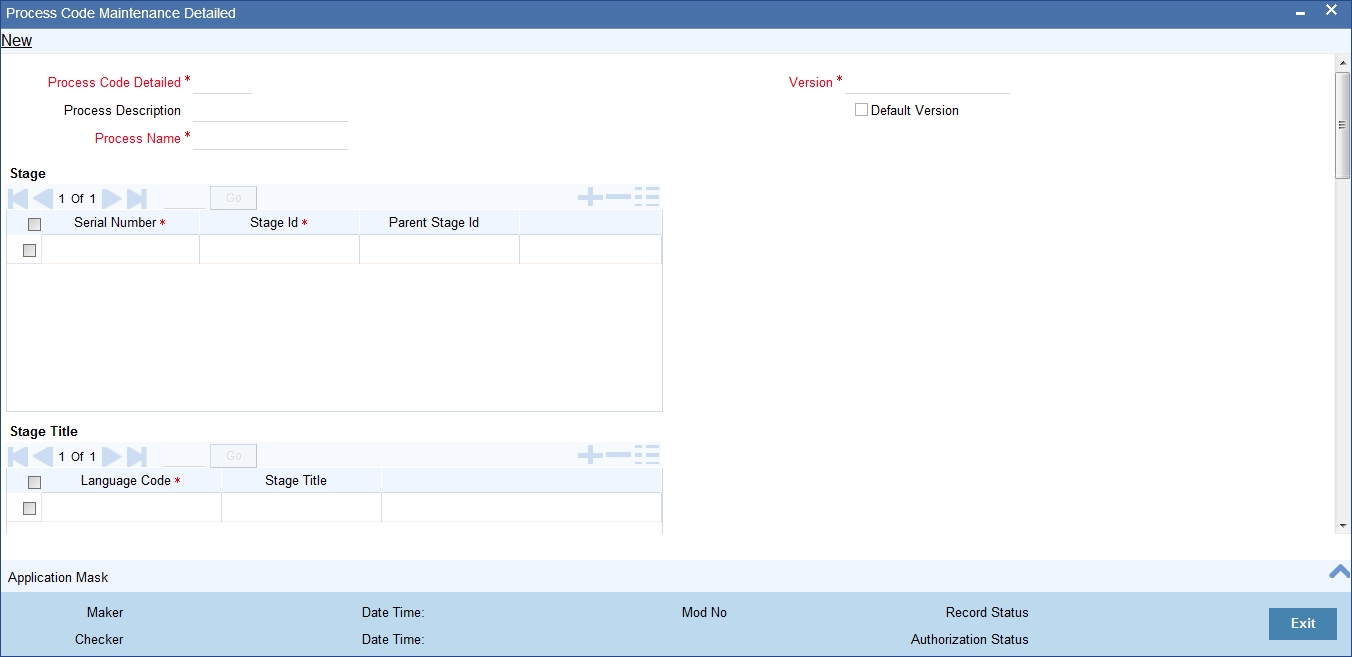
Specify the following details in the above screen:
Process Code Detailed
Specify a unique code for the process.
Process Description
Give an appropriate description for the process.
Process Name
Specify the name of the process.
Rule ID
Specify the Rule ID to be mapped to this process. Alternatively, you can also select the required Rule ID from the option list. The list displays all valid rule IDs maintained in the system.
Rule Description
The system displays the rule description based on the rule ID.
Version
Specify the process version.
You can view the stage, stage title and stage tasks status in this screen.
Stage
You can view the following details of each stage in this multi grid:
- Serial Number - Serial number of the process.
- Process Code - Unique process code of the stage.
- Stage ID - Indicates different stages of a particular process.
- Parent Stage ID - Indicates parent stage ID for the current stage.
Stage Title
You can view the following title details of each stage in this multi grid:
- Language Code - Indicates the language of the current stage.
- Stage Title - Indicates the title of the stage.
Stage Tasks
You can view the following task details of each stage in this multi grid:
- Serial Number - Serial number of the process.
- Task ID - Indicates the different tasks of a particular process.
- Flow ID - Indicates the different parallel flows in a stage.
- Task Type - Indicates whether the task type is human task or service call.
- Function ID - If the task type is human, then the function ID is mandatory.
- Service Identification - Indicates the service name for a service type task.
- TAT (in minutes) - Indicates the approximate duration required to complete a task.
- TAT Warning (in minutes) - Indicates the approximate duration required to send warning notification to a task.
- TAT Escalation (in minutes) - Indicates the approximate duration required to send escalation notification to a task.
- Estimated Completion Duration - Indicates approximate duration required to complete a task.
3.2.2 Business View of Stage Status
Click ‘Stage Status’ button in the landing page queues to view the business representation on the progress of the process. The system displays the following screen:

In this screen, you can view the graphical representation of the application flow.
You can view the Work Flow Reference Number on the top of the screen.
You can mouse over a stage to view the schedule details window. The following details are displayed in the tool-tip window:
- Stage
- Projected Arrival Date
- Projected Completion Date
- Actual Arrival Date
- Actual Completion Date
Click ‘Re calculate Schedule’ button to re-calculate the projected arrival date and projected completion date of the up coming stages. The system calculates these dates based on the current stage status.
Click ‘Stage Status’ button to view the detailed application flow for BPMN process. The system displays an error message for BPEL process.
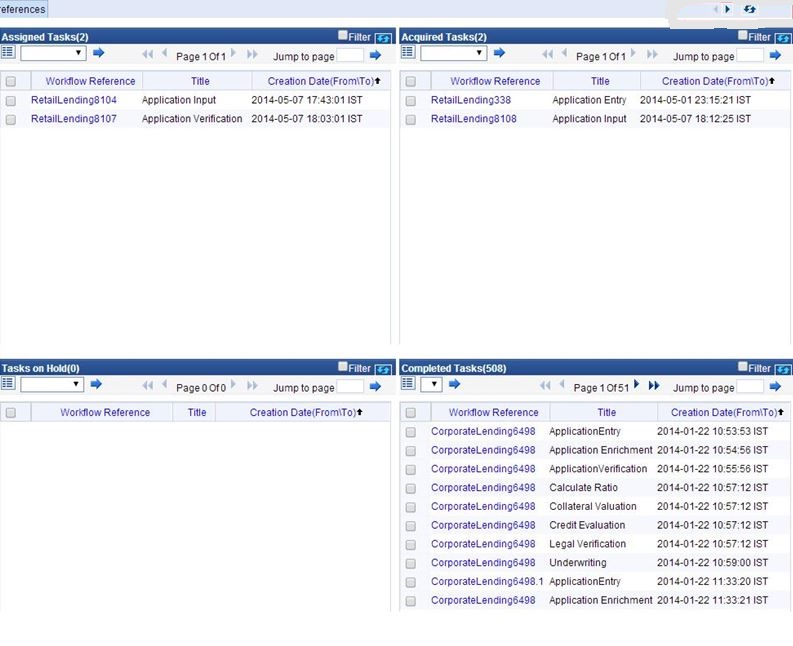
3.3 Dashboards
Oracle FLEXCUBE allows you to configure dashboards with multiple queues, count various queues and map dashboards to specific user roles or users.

Mouse over on an item on the dashboard to view the details in a pop-up window.
Following are the features of Origination Dashboards:
- Blow Up - On clicking the ‘Blow Up’ button, system gives a detailed view of the particular frame in the dashboard.
- Refresh - On clicking the ‘Refresh’ button, system refreshes the particular frame in the dashboard.
- Filter Search - On checking the ‘Filter’ box, system displays the filter criteria. Using the filter option, you can search a particular task in a particular queue dashboard as well as in all queue dashboards.
- Actions - You can select task-specific actions such as Acquire, Copy, Release, Status, Resume, etc, on the dashboard queues.
- Tool Tip - You can view the details of the task when you place the cursor on the Workflow Reference Number of a particular task in the queue frames of the dashboard.
Note
Each dashboard has minimum one to maximum six frames.
Following are the pre-configured dashboards available in the system:
- Default Dashboard - This dashboard lists the Assigned, Acquired, Pending, Completed, High Priority tasks along with the Action List which lists the Escalated, Expired, Aging, High Priority and Today queue count.
- Cancelled Applications - This dashboard lists the cancelled Applications in Retail Lending, Corporate Lending, CASA and Trade.
- High Priority - This dashboard lists the high priority Applications in Retail Lending, Corporate Lending, CASA and Trade.
- High Value - This dashboard lists the high value Applications in Retail Lending, Corporate Lending, CASA and Trade.
- Quick View - This dashboard can be mapped to the Quick View frame. It displays details such as task count in each category (Escalated, Expired, Aging, High Priority and Today queue count) and Assigned, Acquired and High Priority Queue Dashboard.
You can click on workflow reference number to launch the application. The system launches the queue on click of the queue name in the count dashboards.
In addition to the pre-configured dashboards, you can create additional dashboards using the ‘Origination Dashboard Maintenance’ screen.