WEALTH MANAGEMENT
Wealth Management or Investment Management is an important offering in a bank's product bundle. Wealth management services offered by banks usually involves risk profiling a client and recommending investments that suit the risk profile. Investments could be in multiple instruments like Mutual Funds, Equity shares, Bonds etc. Performance of these investments are regularly tracked.
OBDX Wealth Management functionality supports placing of opening of Investment account, Risk profiling , Mutual Fund order placement and tracking of these mutual funds’ performance
Features Supported In the Application
The Wealth Management module of the application supports the following features:
- Open Investment Account
- Risk Profiling
- Purchase Mutual Funds
- Redeem Mutual Funds
- Switch Mutual Funds
- Order Status
- Investment Details
- Transaction Report
- Capital Gain Report
- Dividend Report
![]() How to reach here:
How to reach here:
Dashboard > Toggle Menu > Wealth Management > Overview
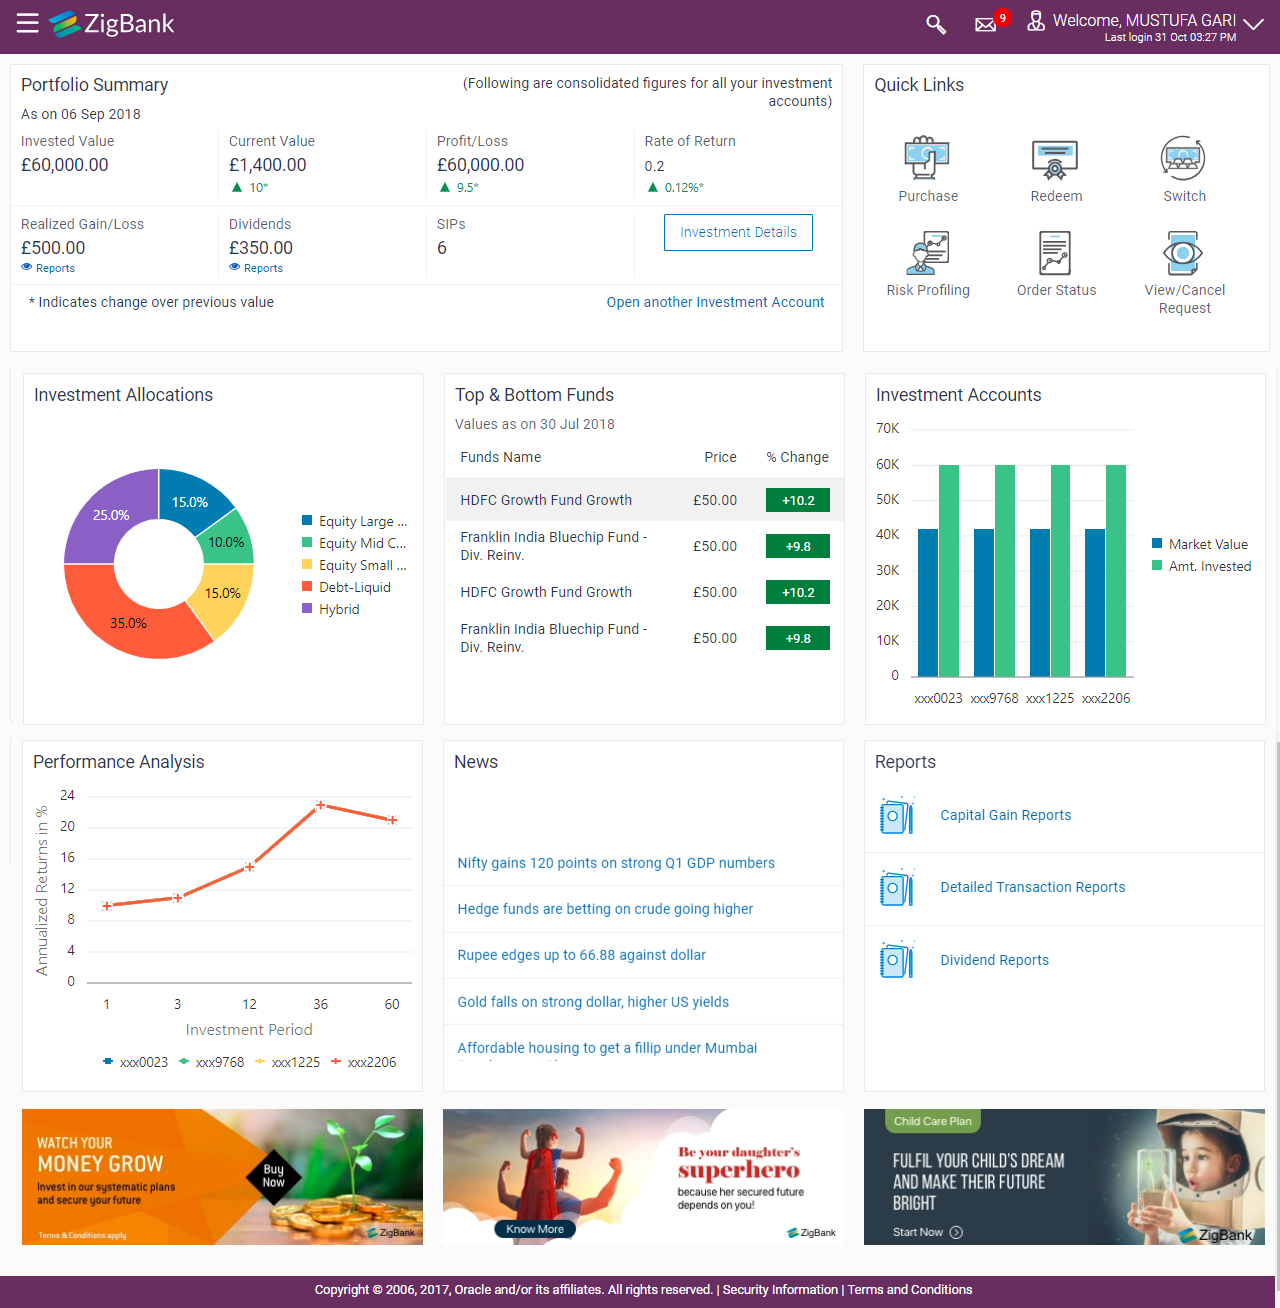
Overview
Wealth Management overview provides you a snapshot of your mutual fund portfolio at a given point of time.
The overview/ dashboard page displays an overview of the customer’s investments with the bank as well as quick links to various wealth management transactions offered to the customer.
|
The Wealth management Overview screen features the following: |
|
|
Portfolio Summary: The Portfolio Summary widget allows the user to view the following:
Click the Reports link in the Realized Gain/ Loss section to access the Capital Gain Report screen. Click to access the Investment Details screen. Click Open another Investment Account link to access the Open Investment Account screen. |
|
|
Quick Links: Quick links to access the following transactions:
|
|
|
Investment Allocation: The investor/ user can view the details summary of all his investment accounts. Doughnut chart displays the distribution of current market value various fund categories along with legends. |
|
|
Top & Bottom Funds This widget displays the following details:
|
|
|
Investment Accounts The investment account details are displayed in the form of bar chart. The X axis denotes the investment amount and current market value (Two vertical bars) of the investment accounts where as Y axis denotes the amount. |
|
|
Performance Analysis The widget allows the user to view the performance of his investments in graphical form. The graph represents percent return of the investment account over time periods – 1 month, 3 month, 1 year, 3 years and 5 years. |
|
|
News The News widget displays the news feed/ headlines. |
|
|
Reports This widget allows the user to directly access the report instead of navigating from the menus. The following reports can be accessed:
|
|
|
Any offers and rewards as hosted by the bank will be shown in this section of the dashboard. Note: Offers data needs to be supplied to the OBDX . |
|
|
This section of the dashboard displays promotional messages of any bank offerings applicable to the user. Note: Promotions data needs to be supplied to the OBDX |
|