17 Tracing Sessions
This chapter describes how to trace individual sessions in Oracle Communications Service Controller.
About Tracing Sessions
Using Service Controller, you can trace individual sessions. This feature is useful when you need to check how Service Controller components handle a specific session rather than reviewing an entire log of all sessions.
You specify the session to be traced by defining a string that Service Controller should search for in an initial event of the session. If Service Controller finds this string in the initial event, Service Controller traces the session.
The format for specifying the string and the locations within the message in which Service Controller searches the string depend on the message's protocol. For example, to trace a SIP session, you specify the user part of a SIP URI. Service Controller searches this SIP URI in the P-Requested-Identity, To, From, and RequestURI headings. Alternatively, for a Diameter session, Service Controller searches the specified string in the Calling-Party-Address AVP and Subscription-id-data AVPs.
Service Controller writes the traced information into the log file. All log files are stored in /ocsb62/managed_server/.
Service Controller stops tracing the session when the session is released.
About the Format of the Search String
The following sections explain the format in which you specify the string and the locations within the messages where Service Controller searches:
-
SIP. See "SIP" for more information.
-
SMPP. See "SMPP" for more information.
-
CAP. See "CAP" for more information.
-
WIN. See "WIN" for more information.
-
AIN. See "AIN" for more information.
-
MAP ANSI. See "MAP ANSI" for more information.
-
Diameter. See "Diameter" for more information.
SIP
Service Controller searches in the following SIP headers:
-
P-Asserted-Identity
-
From
-
Request URI
-
To
To define a SIP URI, specify the user part of the SIP URI. To define a Tel URI, specify the telephone number.
SMPP
Service Controller searches in the following SMPP fields:
-
dest_addr
-
source_addr
In the search string, specify the telephone number of the call recipient or originator.
CAP
Service Controller searches in the following CAP headers:
-
Calling-party-number
-
Additional-calling-party-number
-
Called-party-number
-
Called-party-BCD-number
-
Destination-subscriber-number
In the search string, specify the BCD digits.
WIN
Service Controller searches in the following WIN headers:
-
Mobile-Directory-Number
-
Calling-Party-Number-Digits1
-
MsId
-
Digits
In the search string, specify the BCD digits.
AIN
Service Controller searches in the following AIN headers:
-
Calling-Party-Id
In the search string, specify the BCD digits.
MAP ANSI
Service Controller searches in the following MAP ANSI headers:
-
Mobile-Directory-Number
-
MS-ID
In the search string, specify the BCD digits.
Diameter
Service Controller searches in the following Diameter AVPs:
-
Service-Information AVP /Ims-Information AVP/Calling-Party-Address AVP (Ro and Rf). In the search string, specify the full SIP URI of the calling party, including the SIP prefix, user part, and domain part. For example: sip:calling@seagull.com.
-
Subscription-id AVP/Subscription-id-data AVPs (Ro only). In the search string, specify the identifier of the subscriber. For example: imsiNumber.
-
Service information/Subscription-id/Subscription-id-data AVPs (Rf only). In the search string, specify the identifier of the subscriber. For example: imsiNumber.
About Session Tracing Modes
The user needs to select one of the following modes of tracing:
-
Internal events tracing. See "Internal Events Tracing" for more information.
-
Full session tracing. See "Full Session Tracing" for more information.
Internal Events Tracing
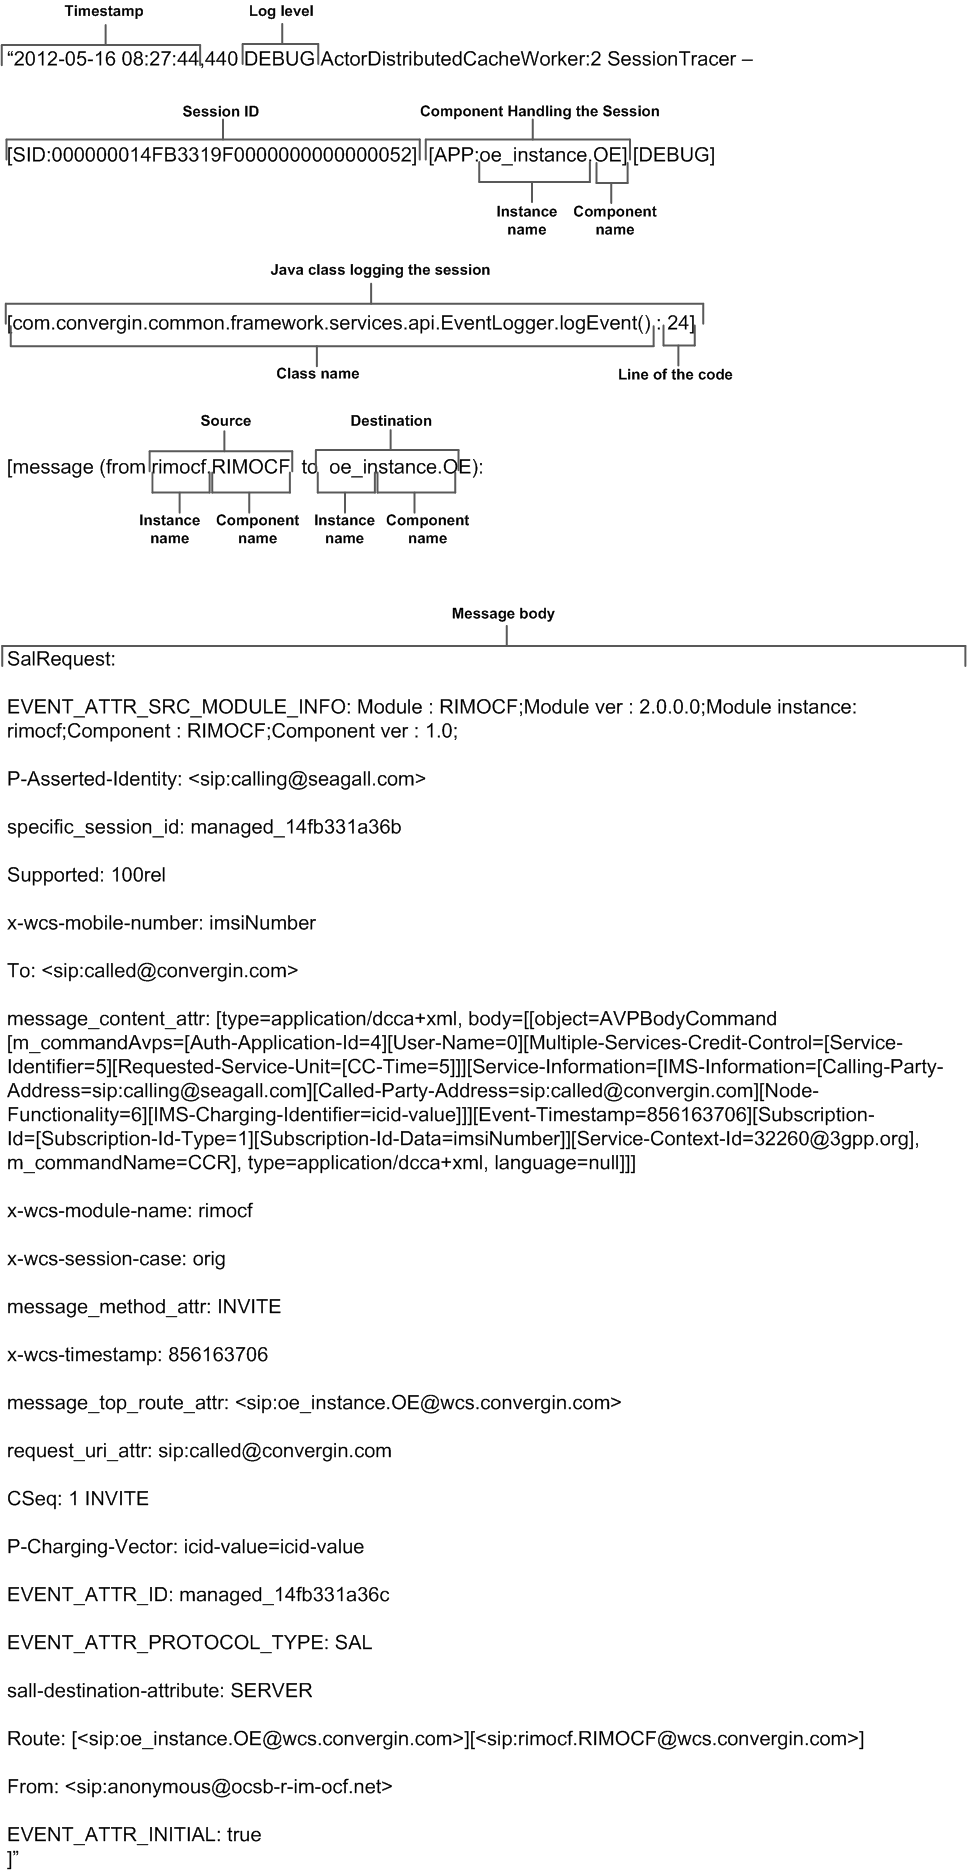
You might need to trace internal events when you want to monitor the behavior of a session and identify a possible cause of the problem. For example, you can use the Internal Events Tracing mode to check whether the session passes through the Service Controller components according to the Service Controller configuration.
When tracing internal events, Service Controller records the following information about the session into the log file:
-
Timestamp that indicates when the session began
-
Logger level
-
Session ID
-
Service Controller component which is currently handling the session
-
Java class that logs the session
-
Service Controller component and instance of the component that sends the session (source)
-
Service Controller component and instance of the component that receives the session (destination)
-
Message body
The following example shows the fragment of the log that contains the information about the session sent by the R-IM-OCF interworking module to the Orchestration Engine (OE):
Full Session Tracing
You might need to use the Full Session Tracing mode when the Oracle support team requests you to log a session in order to investigate the issue.
When logging a session in the Full Session Tracing mode, Service Controller logs the following information about the session:
-
All the information logged in the Internal Events Tracing mode.
-
All debugging messages defined in the Service Controller programming code. These messages are for internal use by the Oracle support team.
Tracing a Session
To trace a session:
-
In the navigation tree, expand OCSB.
-
Expand the Processing Tier node.
-
Expand the Tier Management node.
-
Click the Overload and Tracing node.
-
Click the Session Tracing tab.
-
In the User-id field, enter the string that Service Controller should search in the initial request. See "About the Format of the Search String" for more information.
-
From the Session Granularity list, select one of the following:
-
When you want to trace a message, select INTERNAL_EVENTS. See "Internal Events Tracing" for more information.
-
When you want to trace the session, select FULL_SESSION. See "Full Session Tracing" for more information.
-
-
Click Apply to save your changes.
