Trend Graph Period: when a Trend Graph is included in the selected tab, the Period drop-down list is shown on the left side of the Toolbar. You can specify the period that is graphically represented.
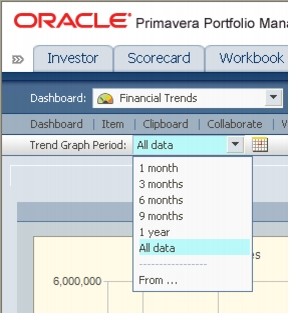
You can show ALL data that has been collected since item inception, or select a particular period (e.g. 3 months) from the drop-list.
To exclude prior data from the graph, select the From option from the drop-list and specify the date on the popup calendar. You may also click directly on the ![]() icon to open the pop-up calendar.
icon to open the pop-up calendar.
![]()
The right side of the toolbar displays the following buttons:
- Save - Updates the system with all the new data that was entered in the dashboard and records the date and time of the update.
Notes:
- The system saves your data automatically when you navigate to another module or close your browser screen.
- When saving a dashboard, all the tabs are saved, not just the currently displayed one.
- Reset - Replaces all the new values that were entered in the dashboard since the last save.
- Spelling - Checks the spelling on the currently displayed tab. Click
 to open the Spell Check dialog box.
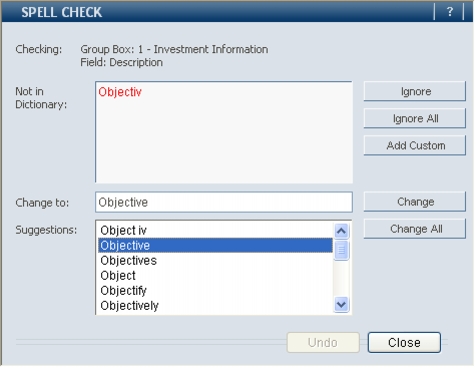
- Words that do not appear in the Spell Checker's standard and/or custom dictionaries appear in the Not in Dictionary box. You may choose one of the following options:
- Ignore: The word will be left as is.
- Ignore All: All instances of the word will be left as they are.
- Add Custom: The word will be added to your custom dictionary.
- Change: Whatever you entered into the Change to box, or selected from the Suggestions box, will replace the current word.
- Change All: Whatever you entered into the Change to box, or selected from the Suggestions box, will replace all the instances of the current word.
- Words that do not appear in the Spell Checker's standard and/or custom dictionaries appear in the Not in Dictionary box. You may choose one of the following options:
- Print - Prints the dashboard.
- Send Email - Sends an email with a web link (URL) to your dashboard.
- Knowledge - Opens a Knowledge dialog box with dashboard related Knowledge (if available).
- Tab Component Knowledge: The
 icon appears at the top-right corner of the group box title bar. Clicking the icon will open the knowledge dialog box. When there is no knowledge, the
  icon appears ghosted.
 When a single graph is set within the group box, and has associated knowledge, the icon is enabled. Clicking on the icon opens a dialog box where the knowledge is shown.
When more than one graph is set within a group box, there is a drop-list arrow next to the icon.
Clicking the arrow opens a drop list of the different graph labels. Graphs which have associated knowledge are enabled. Graphs with no associated knowledge are disabled. Clicking on the enabled graph label opens the relevant Knowledge dialog box.
- Tab Component Knowledge: The