As a project manager or administrator, you can arrange the portlets you want on a shared dashboard for other users to view.
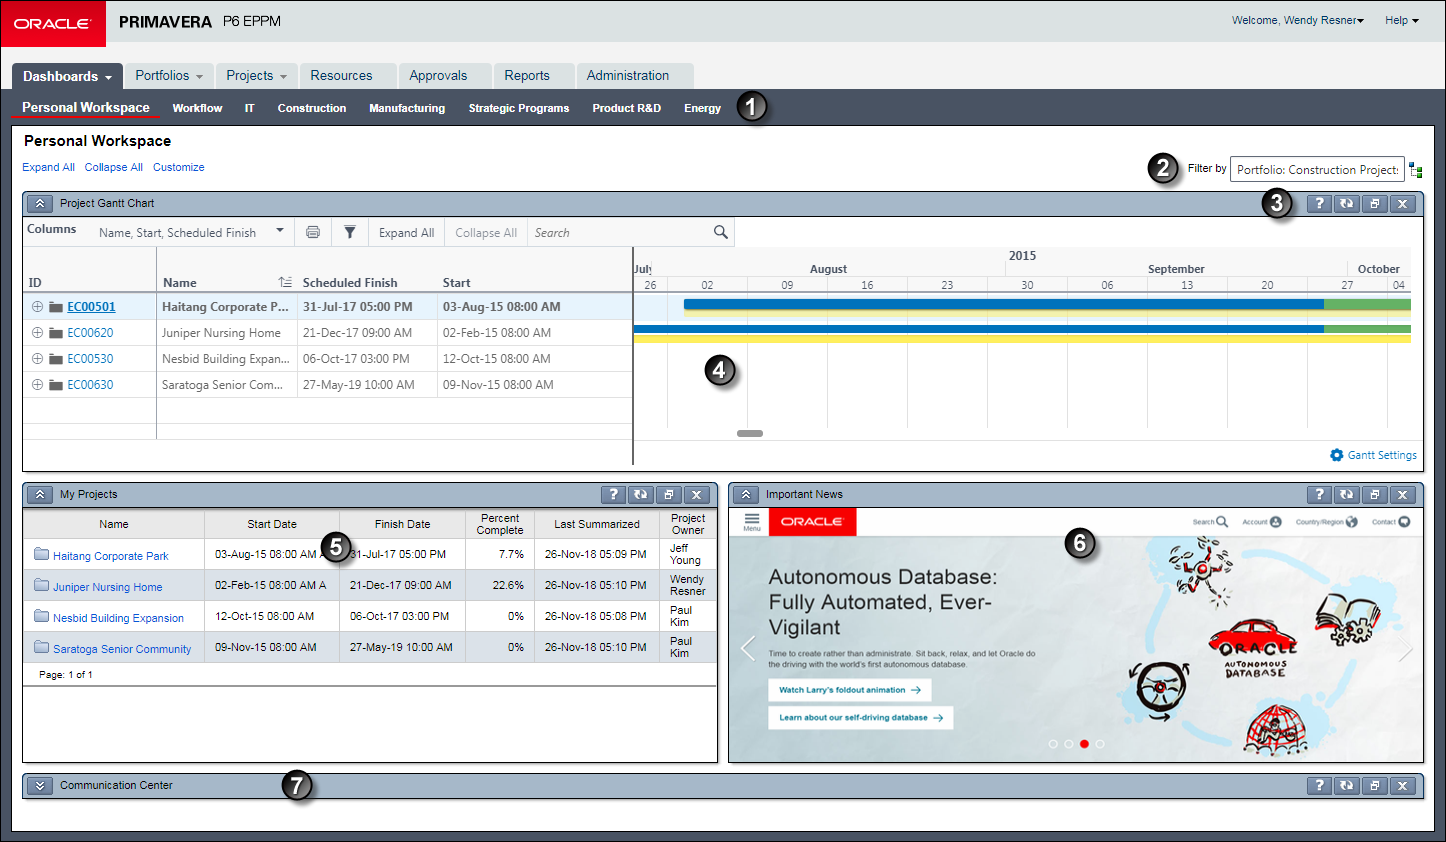
Table 1 of 2: Working with Portlets
Item | Description |
|---|---|
| Dashboards Page: Portlets appear on dashboards. In this example, the Dashboards page presents a series of tabbed dashboards. The currently selected dashboard also shows links for expanding and collapsing its portlets, as well as a Customize button where you can configure the portlets that appear. |
| Dashboard Filter: The same portlets are capable of displaying data for any number of projects. Use this field to filter all portlets on a dashboard by project, portfolio, or projects sharing a project code. |
| Portlet Titlebar: In addition to its title, each portlet's titlebar shows icons for expanding or collapsing, accessing help, refreshing, maximizing or restoring, and closing it. Some portlets also include a print icon. |
| Wide Layout Size: The Project Gantt Chart portlet is positioned on top and set to a wide size. Each portlet includes features unique to itself, such as toolbars, customizable elements, filters, links to other data, and mouseover tooltips. |
| Narrow Layout Size: The My Projects portlet is positioned below it and to the left in a narrow size. This portlet requires that you select a resource team before it can display any data. |
| Custom Portlet: You can use a portlet to display custom online content. |
| Collapsed Portlet: The Communication Center portlet is collapsed. Expand it to view its contents. |
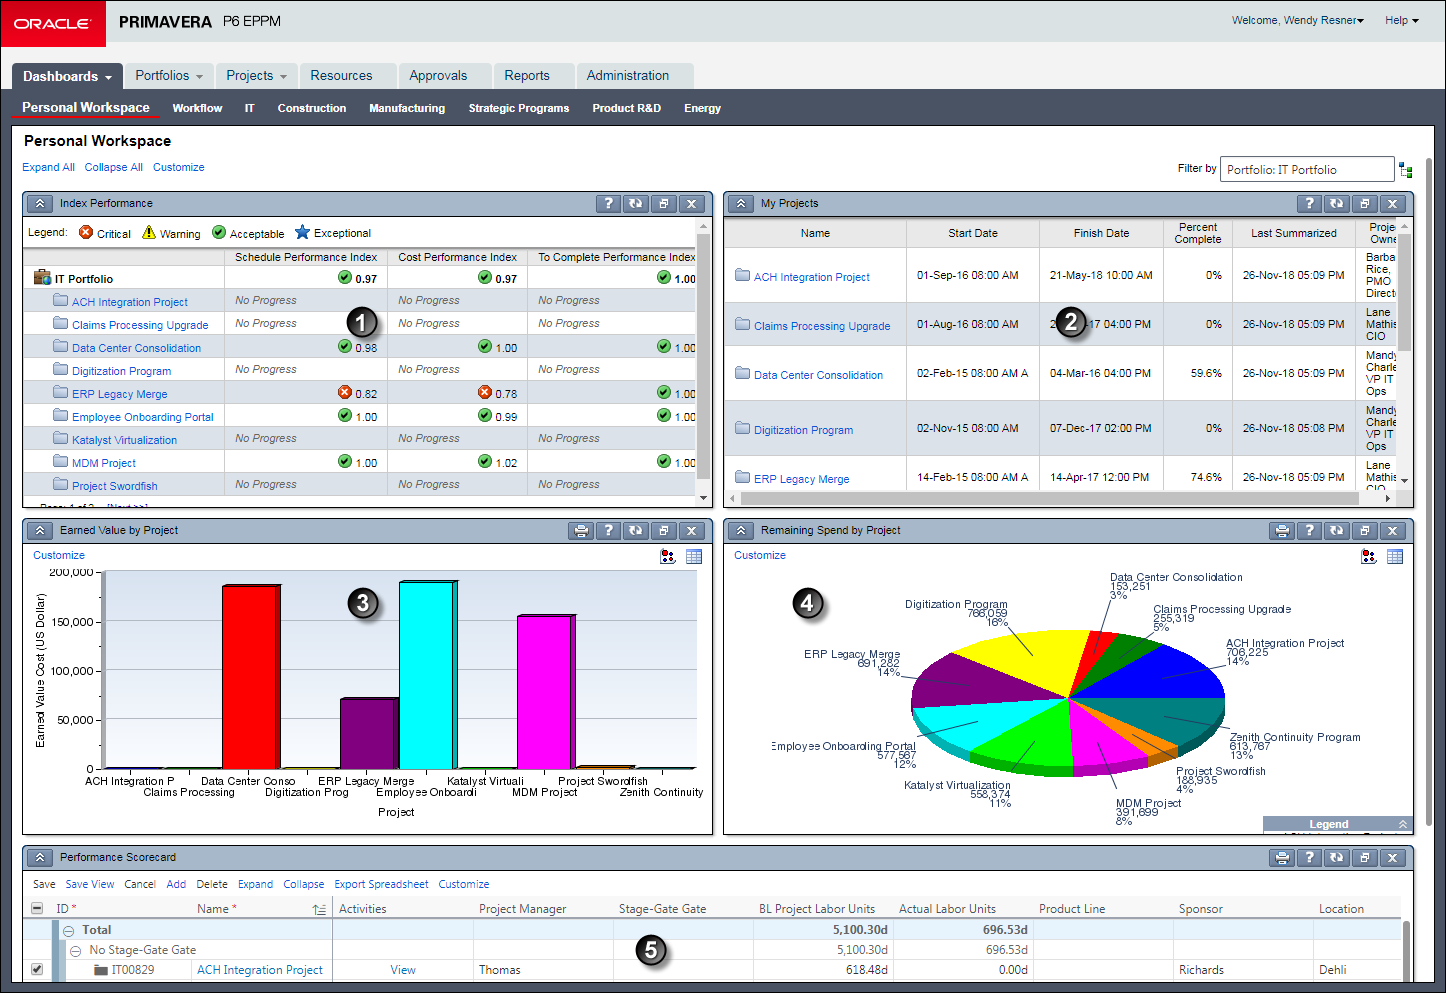
Table 2 of 2: Working with Portlets
Item | Description |
|---|---|
| Performance Portlet: Quick visual indicators immediately report status in the Schedule, Earned Value, and Index Performance portlets. |
| My Projects Portlet: This portlet provides a high-level listing of each project's current status. Click a project name link to open the project. |
| Histogram: This portfolio view portlet has been formatted as a histogram comparing earned value data per project. |
| Pie Chart: This portfolio view portlet has been formatted as a pie chart and configured to show its data labels and a color-coded legend. Other formats available include bubble charts, scorecards, and three varieties of histogram. |
| Scorecard: This portfolio view portlet has been formatted as a scorecard with a custom assortment of columns. |