In addition to plotting data along the x-axis and y-axis, bubble charts also adjust the relative size of each entity's bubble or circle to depict a third value, and they group the data by still a fourth value.
Example: Sheila wants to compare the projects in the Engineering & Construction portfolio with those in Energy Services. She navigates to the Portfolio Analysis page and customizes the portfolio views, filters, and bubble chart options shown below. She sets Original Budget to display on the x-axis and At Completion Total Cost on the y-axis. Next, she selects Remaining Total Cost as the Bubble Size and sets the Group by list to Project. When the chart appears, each bubble represents a single project; the size of the bubble represents the Remaining Total Cost value for the project; the bubble's position on the x-axis represents its Original Budget value for the project; and the bubble's position on the y-axis represents the At Completion Total Cost value for the project. Sheila configures a second bubble chart to display these settings for another portfolio. The chart data is again grouped by project.
Note: To support comparative analysis, the Portfolio Analysis work area is divided into two nearly identical parts with the key difference being the data that appears in each part. The elements below appear within each part.
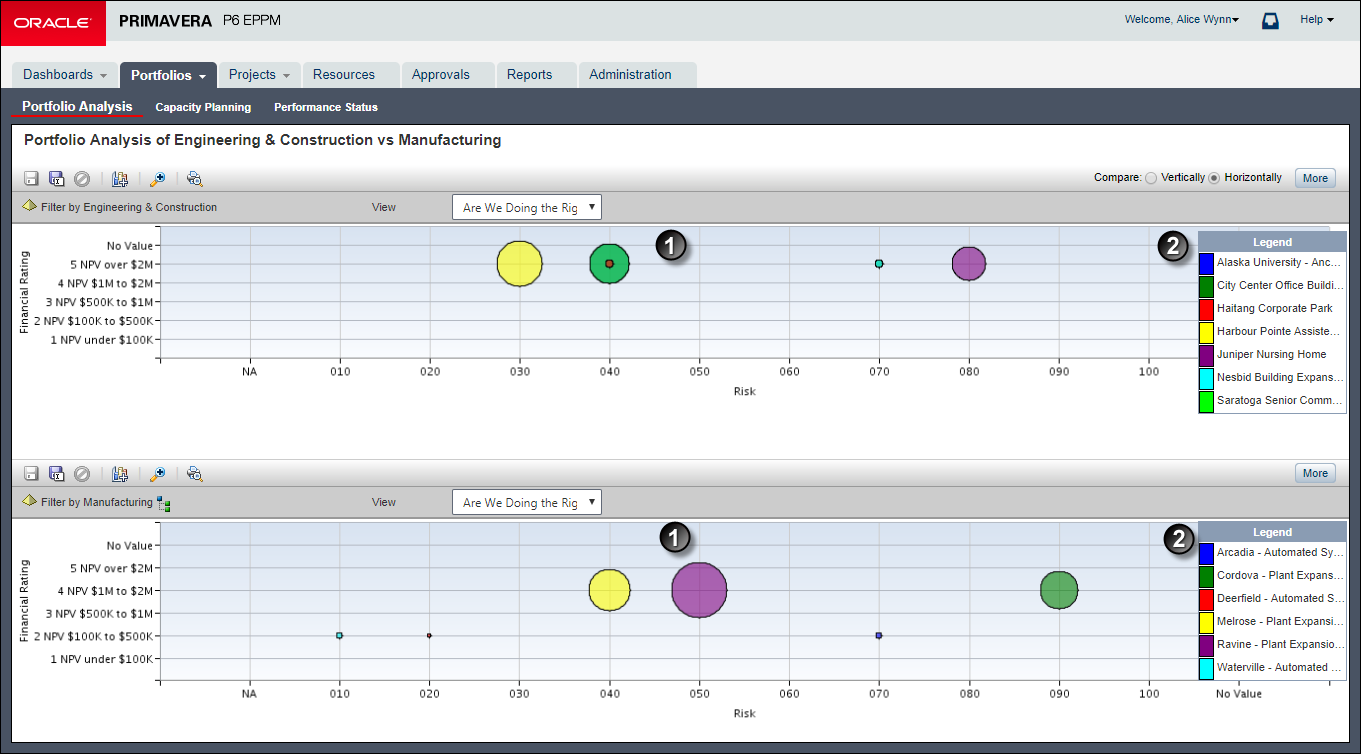
Table of Key Bubble Chart Elements
Item | Description |
|---|---|
| Bubble Chart: Your chart will appear in this section. Mouse over a bubble to view its source data. |
| Legend: Based on the Group By field, each item in the legend is assigned a color from the selected Color Theme palette. |