The Preview tab enables you to preview the earned value analysis for the P6 projects (cost loaded and resource loaded) in the Activity Sheet without opening the Earned Value Analysis sheet.
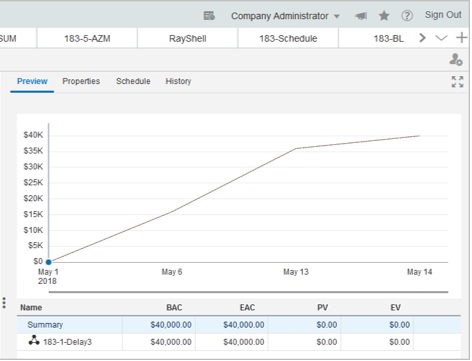
- The upper section in the tab displays a graph with consolidated information of PV and AC across data dates. A vertical blue bar represents the last data date.
- The lower section shows the Summary Table with columns displaying EV metrics and derived values: BAC, EAC, PV, EV, AC, ETC, RC, CV, SV, VAC, CPI, SPI, CSI, TCPI(EAC), TCPI(BAC) for projects satisfying the last data date.