You can configure the content layout by doing the following:
- Add one or more charts in each column.
- Set up filter conditions and title for each chart.
- Add the same chart multiple times to the same column and display the same report with different query parameters.
To configure the resource manager dashboard
- From the Resource Dashboard log, click Edit and choose one of the following:
- Left Column: The Left Column Blocks window opens.
- Right Column: The Right Column Blocks window opens.
These are set up the same way.
- To add a chart, click Add. Complete the Add Summary Block window:
- Report Name: Click Select. Choose a chart from the list and click OK. The report fields are auto-populated. You can edit the title if desired.
- Specify filter conditions:
- Roles and projects are multiselect fields (you can choose one or more from the list).
- If fields are left empty, it means all.
- Project field is disabled in the project-level dashboard and displays the current project.
To edit a chart on the blocks list
Select it from the list and click Open.
To delete a chart on the blocks list
Select it from the list and click Delete.
- Roles and projects are multiselect fields (you can choose one or more from the list).
- If fields are left empty, it means all.
- Project field is disabled in the project-level dashboard and displays the current project.
- Shows current project.
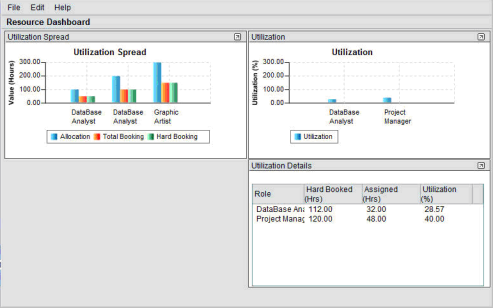
Example project resource dashboard