You can add a drilldown block that allows you to access greater levels of data detail.
Note: If a Drill Down block has Cost Sheet columns that are based on a formula, then the data will not be displayed:
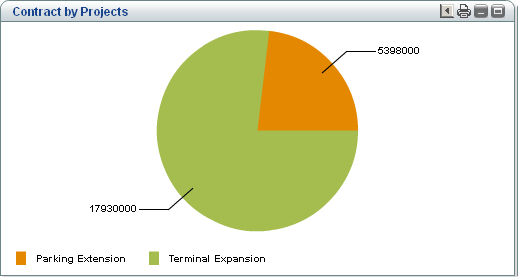
For example, if a dashboard block shows a pie chart with data for two projects, called Parking Extension and Terminal Expansion, and you can double-click on Terminal Expansion to expose the vendors on that project.
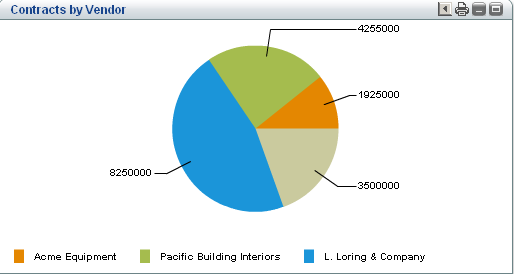
To continue the example, when you double-click on Terminal Expansion the to access the vendor information, and the amount associated with the vendors Acme Equipment, Pacific Building Interiors, and L. Loring & Company:
Note: If you want to use filters on your dashboard blocks, you must first define a drilldown block.
To add a drilldown block to your shell dashboard
- On the Edit Dashboard window, click Add > Drilldown. The Edit Drilldown Block window opens. Drilldown functionality is supported for charts only, and is not available for grids or tables. Drilldown will stop when a grid or table is encountered. See the first table below.
- Click Add to add Drilldown Details. The Edit Drilldown Details window opens. See the second table below.
- When complete, click OK, and click OK to exit the Edit Dashboard window.
This item | Does this |
|---|---|
Data Cube | Select the data cube definition to use. Data cubes are queries that can be defined and reused to create charts on your dashboard. Your company administrator defines the data cubes. |
Block Title | Add a title for this block. |
Block Filter Elements | Group By elements from the data cube. This determines which columns from the data cube definition will be used to group data for filtering. |
In this field: | Do this: |
|---|---|
Title | Enter a title for the drilldown. |
Show Data From | Select the shells to use as data sources. |
Display Type | Select the type of display, for example, a bar chart. |
Source Grouped By | Select the columns from the data cube definition that will be used to group data. |
Output Type | Select Record Count or Summary Value. |
Report On | Select the columns from the data cube to be defined as Summary. |
Summary Type | Select the summary type. |
Show Result | Select the type of result, for example, Actual Value. |
Show Total | Select to show the totals for the data. |
Decimal Places | Select the number of decimal places. |
Use 1000 Separator (,) | Select to use a comma (,) as a separator. |
Negative Number Format | Specify the format for negative numbers. |
Currency Format | Select the currency format. |