Unifier Cash Flow module allows you generate and compare Baseline, Actuals (or "spends"), Portfolio, Forecast, Derived, and Custom curves in a project or CBS code-based shell. The curve detail levels include:
- Cash Flow by Project/Shell
You can track the costs associated with an entire Project/Shell over time.
- Cash Flow by CBS
The creation of a CBS detail curve is similar to cash flow by Project/Shell. Use this option if cash flow needs to be tracked at the CBS level as opposed to the Project/Shell level, by allowing you plot cash flow curves by specific CBS codes, or all codes, in the Project/Shell.
- Cash Flow by Summary CBS
The creation of a Summary CBS detail curve is very similar to cash flow by CBS. Use this option if cash flow needs to be tracked by summary CBS codes. In order to select this option, the Project/Shell cost sheet must use a tree structure (and therefore has summary CBS codes) rather than a flat structure.
- Cash Flow by Commitment
This option allows you to plot and analyze cash flow data for an entire commit record (including base commit, any change commits, and related invoices). You can choose a specific business process commitment record within the Project/Shell, such as a purchase order or contract, and track the cost information over time. Each commitment record can have one baseline curve.
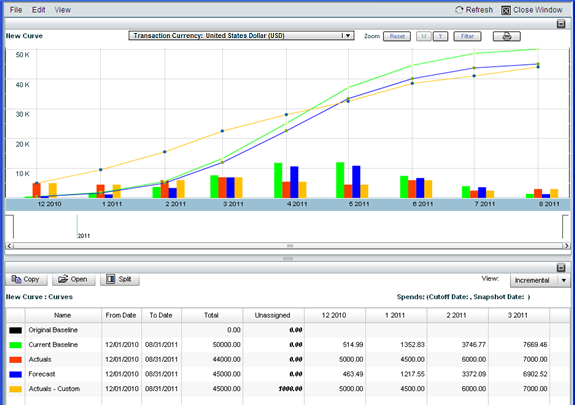
- Unifier displays Cash Flow curve detail level data in a Cash Flow Worksheet. The cash flow curve worksheet can display any number of Baseline, Forecast, Actual (or Spends), Portfolio Budget, Derived, or Custom curves (based on the same detail level). Depending on curve set up you can manually enter manual, pull data automatically from other sources such as business processes, cost sheet columns and schedule manager dates (depending on the curve type), and compare multiple curves. Here is an example of a cash flow detail curve worksheet and curves.
At runtime, the user can view the cost distribution information by CBS code from a schedule sheet see Create a Cash flow curve from a Schedule Sheet.
To facilitate creation of cash flow curves and roll up of data to program and company cash flow worksheets, you can create the following in Administration Mode (Admin mode):
- Data Sources
- You create data sources that can be used to create and identify cash flow curves, and roll up data to program and company worksheets. You will need to create data sources in order to create cash flow curves.
- Data sources are created based on a Curve Type: Baseline, Forecast, Actual (or Spends), Portfolio Budget, Derived, or Custom curves. Each curve type has its own logic to address different business requirements.
- Distribution Profiles
These are optional. Distribution profiles can be applied to cash flow curves to automatically distribute cost data across a specified time period. At runtime, you will have the option of manually distributing data in the cash flow worksheet, or automatically distributing the data using one of these profiles.
- Company-level Templates
These are also optional. You can create cash flow detail curve templates, which can be used to create new curves at runtime within a project and shell; and rollup curve templates, which you can use to create program curves to roll up cash flow data from projects or shells.
- Project/Shell-level Templates
You can create cash flow curves within a project template or a CBS-code based shell template. These can be used to create new curves in projects or shells; they can also be used to "push" out updates to existing curves. Update cash flow curve properties and permissions.