Purpose
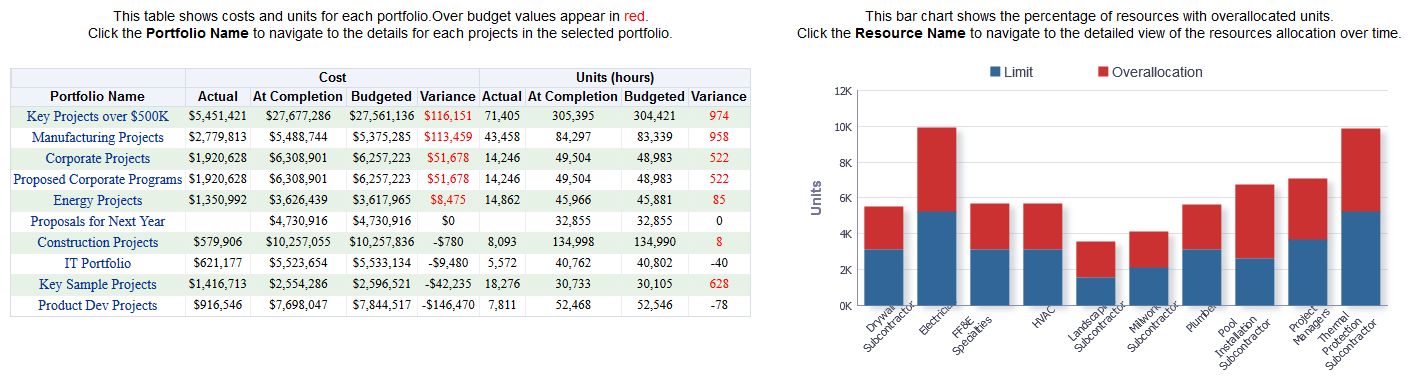
The pivot table shows costs and units for each portfolio. Over budget values are highlighted in red text.
The pivot table contains columns for:
- Portfolio Name
- Actual (Cost)
- At Completion (Cost)
- Budgeted (Cost)
- Variance (Cost)
- Actual (Units)
- At Completion (Units)
- Budgeted (Units)
- Variance (Units)
The stacked bar graph shows a stacked bar for the number of Remaining Units and Overallocation Units. There is a bar for any resource that is overallocated.
The x-axis shows Resource Name. The y-axis shows Units in hours. Hover over a bar for specific details.
Location
- On the Home page, click Dashboards.
- Under Primavera, select Main.
- On the Main dashboard, click the Overview page.
- On the Overview page, expand the Portfolio Summary section.
Subject Area
Activity