Purpose
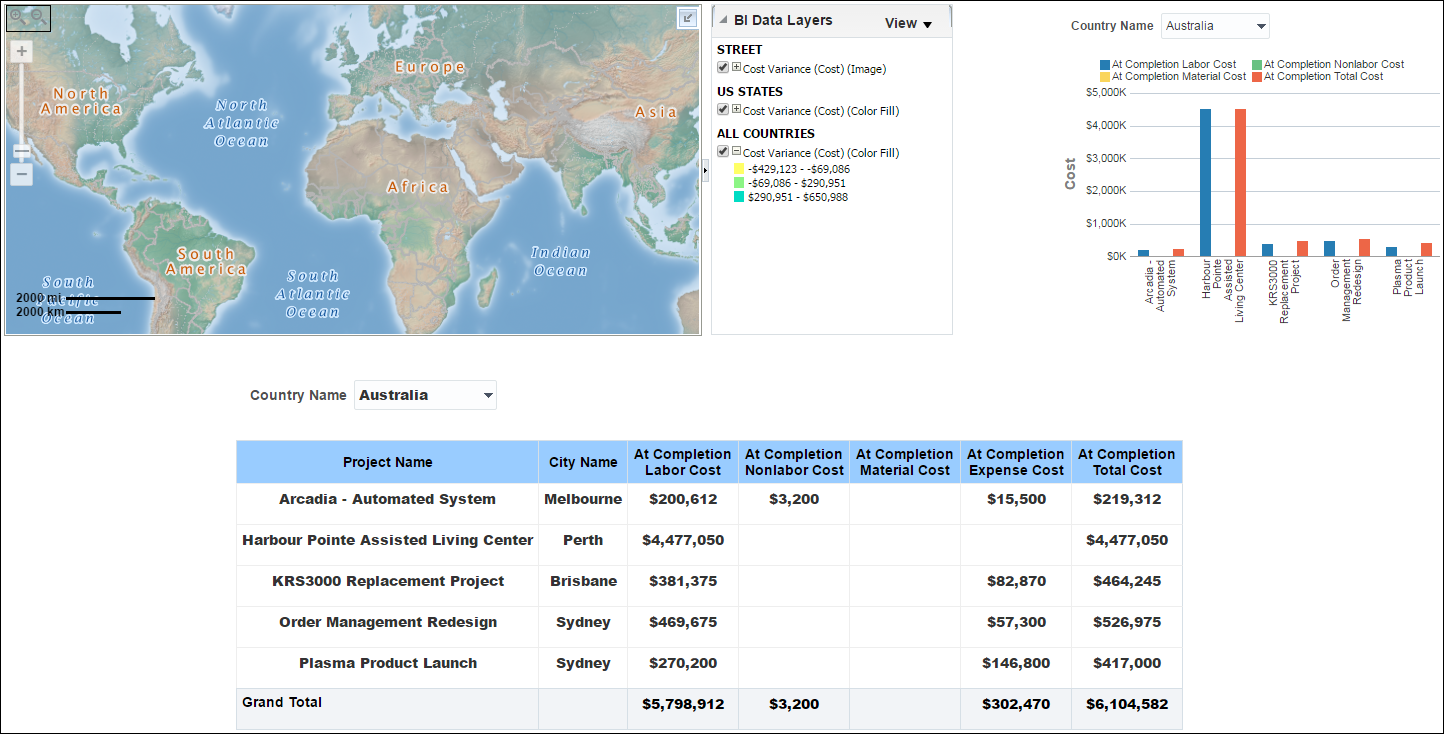
The map shows Cost Variance Index by country code when zoomed out to country level. White areas of the map indicate that no project is located in that area.
Switch off the Cost Variance (Cost) (Color Fill) option below ALL COUNTRIES to remove the shading. Zoom in and out with the control on the left and hover over a country, state, or province to see specific information and for a link to the country code which will filter the table and bar graph.
The pivot table uses geospatial data stored by the Location settings in P6 to show projects assigned to the country code selected. Each of the cost columns is totaled on the bottom line of the table to give a grand total for that country code.
For each project, the table contains columns for:
- Project Name
- City Name
- At Completion Labor Cost
- At Completion Nonlabor Cost
- At Completion Material Cost
- At Completion Expense Cost
- At Completion Total Cost
The bar graph has the following cost bars for each project:
- At Completion Labor Cost
- At Completion Nonlabor Cost
- At Completion Material Cost
- At Completion Total Cost
The x-axis shows project name. The y-axis shows Cost.
Location
- On the Home page, click Dashboards.
- Under Primavera, select Main.
- On the Main dashboard, click the Location page.
- On the Location page, expand the Completion Cost by Location section.
Subject Area
Activity