Purpose
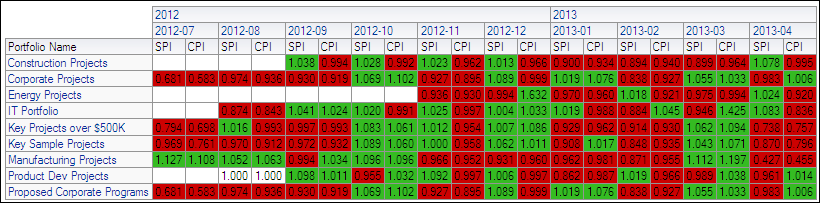
The pivot table shows CPI and SPI per month for each portfolio. CPIs and SPIs lower than 1.000 are highlighted in red; CPIs and SPIs higher than 1.000 are highlighted in green. Values of exactly 1.000 are not highlighted.
Location
- On the Home page, click Dashboards.
- Under Primavera, select Portfolio Analysis.
- On the Portfolio Analysis dashboard, click the Performance page.
- On the Performance page, expand the Portfolio Analysis Trending section.
Subject Area
Activity