Purpose
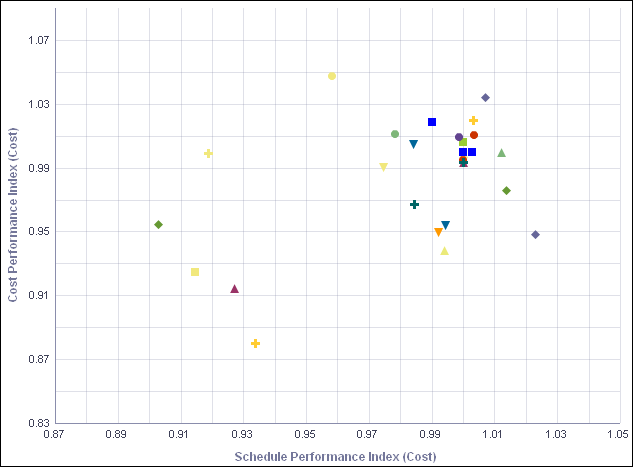
The scatter chart plots each project according to its SPI and CPI.
The x-axis shows Schedule Performance Index (Cost). The y-axis shows Cost Performance Index (Cost). Hover over a point to see specific information.
Location
- On the Home page, click Dashboards.
- Under Primavera, select Project Earned Value.
- On the Project Earned Value dashboard, click the CPI/SPI page.
- On the CPI/SPI page, expand the Cost & Schedule Performance Index section.
Subject Area
Activity